Do You Want to Know When Large Operators Are Buying?
Perfectly understanding how and why accumulation and re-accumulation processes develop provides a much more solid and effective approach when making trading and investment decisions.

Rubén Villahermosa
Trader and educator
What is Wyckoff accumulation?
Wyckoff accumulation is a sideways range, preceded by a bearish move, in which large operators (strong hands) absorb stock from weak hands in order to sell it later at higher prices. According to the Law of Cause and Effect, the time price spends building that cause determines the reach of the subsequent uptrend.
Article Summary
Accumulation is a lateral range where large operators (strong hands) absorb stock from weak hands after a decline. This process is necessary to turn the market bullish: according to Wyckoff's Law of Cause and Effect, time in range (cause) determines the magnitude of the subsequent movement (effect). Professionals use manipulation maneuvers like the Spring to capture liquidity and complete their accumulation before initiating the bullish trend.
Video in Spanish with English subtitles available

Accumulation
An accumulation range is a lateral price movement preceded by a bearish movement upon which an absorption maneuver is carried out by large operators with the objective of accumulating stock to be able to sell it at higher prices in the future and profit from the difference.
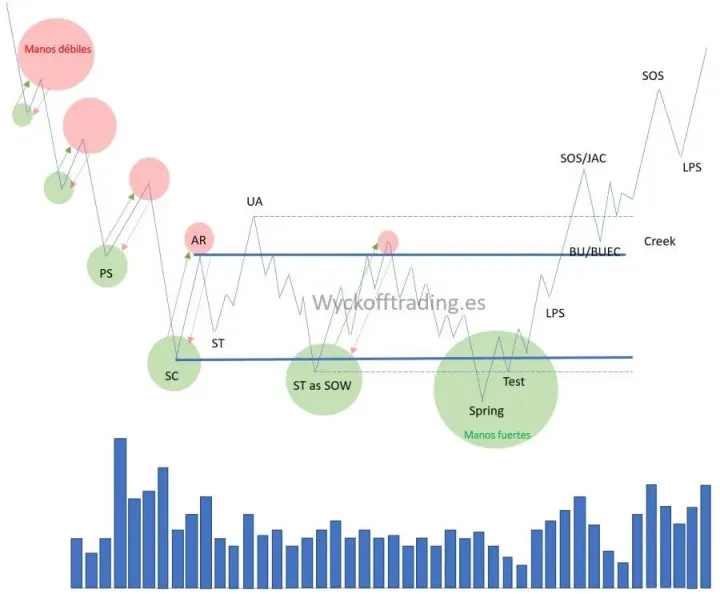
Accumulation schematic with its main events
The 5 Phases of Wyckoff Accumulation
The accumulation structure is divided into five phases, from A to E. This table summarizes what happens in each one, which events make it up and what you should look for on the chart.
| Phase | What happens | Events | What to look for |
|---|---|---|---|
| Phase A | Stopping of the previous downtrend | Preliminary Support (PS), Selling Climax (SC), Automatic Rally (AR), Secondary Test (ST) | Climactic volume on the SC; the SC low and the AR high delimit the range; the ST returns to the SC area with lower volume |
| Phase B | Building of the cause: large operators absorb the available stock. It is the longest phase | Secondary Tests, Upthrust Action (UA) | Progressive decrease in volume and volatility; tests of the upper part of the range without volume |
| Phase C | Definitive test of the remaining supply | Spring / Shakeout and its test | False break of support with quick re-entry into the range and a test on lower volume. It does not always occur |
| Phase D | Trend within the range: buyers take control | Sign of Strength (SOS), Jump Across the Creek (JAC), Last Point of Support (LPS), BackUp to Edge of Creek (BUEC) | Wide bullish moves with volume, rising highs and lows, and pullbacks (LPS) on reduced volume |
| Phase E | Trend outside the range | Exit from the structure and development of the uptrend | Price staying outside the original range, without re-entering |
Stock Control
During the development of the preceding bearish movement, stock control will mainly be in weak hands. To turn a market around, it is necessary for that stock to pass into the control of large professionals, into strong hands.
As the price falls, stock gradually changes hands; the more it falls, the more stock is in strong positions. It is during the development of the accumulation structure where the final absorption process takes place. The moment when price is ready to initiate the bullish turn.
Asset Transfer
Accumulation represents the transfer of stock from "weak hands" (retail traders scared by the decline) to "strong hands" (institutions with vision and resources).
The Law of Cause and Effect
It is in these range conditions where we see the law of cause and effect operating in trading; which tells us that for there to be an effect, there must first be a cause that originates it; and that the effect will be in direct proportion to the cause.
Cause → Effect
In the case of an accumulation range, the purchase of stock (cause) will result in a subsequent bullish trend movement; and the reach of this movement will be in direct proportion to the time the price has spent building that cause (absorbing the stock).
The preparation of an important movement takes considerable time. A large operator cannot buy everything they want at once since executing an order with the full desired quantity would result in worse prices due to the displacement their own order would generate.
To carry out this task, professionals need to plan and execute a careful plan with which they try to absorb all available stock at the lowest possible average price.
Manipulation Maneuvers
In the accumulation process, large operators create an environment of extreme weakness. News at this point is very likely bad and many will be influenced to enter on the wrong side of the market. Through various maneuvers, they gradually acquire all available supply.
The Spring (Shakeout)
In the accumulation range we observe a fundamental event that characterizes this type of context: the bearish shakeout, also known as "Spring". It is a sharp downward movement that breaks the support level of the range and with which large operators serve themselves to carry out a triple function:
- Hit the stop losses of traders who were well positioned on the long side
- Induce misinformed operators to sell thinking the bearish movement will continue
- Profit from said movement
Accumulation Without Spring
While it is true that this shakeout event is an action that adds strength to the bullish scenario, it is also true that it will not always occur. You should be aware that on many occasions the bullish trend will begin to develop without this terminal action taking place. It is a somewhat more difficult context to determine but equally valid.
This is why accumulation is usually drawn in two schematics: Schematic #1, with a Spring in Phase C, and Schematic #2, without it. You can compare both side by side in the Wyckoff Accumulation Schematics section of our Wyckoff Method guide.
At the same time, they need to remove "weak hands" from the market. These are operators who, if positioned long, will close their positions very soon taking small profits. An action they carry out to get rid of this type of weak operator is to generate a flat, boring market context, with the aim of discouraging these operators to finally close their positions.

The Wyckoff Methodology in Depth
The best-selling book on the Wyckoff Method. 325 pages that will teach you to identify institutional money footprints and trade alongside smart money.
Counterparty, Liquidity
Both hitting the stops of long positions, as well as the entry into short of some operators, provides liquidity to the professionals who are accumulating; since both actions execute market sells; and these sells are the counterparty that large operators need to match their buys.
In addition to this, when the bullish reversal occurs back toward the interior of the range, the stops of those who entered with short positions during the bearish breakout will also be executed, adding strength to the bullish movement.
The Path of Least Resistance
Professionals who have interests higher up will not initiate the movement until they have verified that the path of least resistance is upward. They achieve this by performing various tests to check the commitment level of sellers.
As with the Spring, they will initiate downward movements to verify the follow-through it has. An absence of volume at this point would suggest a lack of interest in reaching lower prices. This is why sometimes more than one shakeout is seen within the range; these are tests that professionals develop to ensure they will not encounter resistance at higher prices.
Common Characteristics of Accumulation Ranges
The following are key characteristics of accumulation ranges
Decreasing volume and volatility as the range develops. There will be less and less stock available for sale and therefore, price fluctuations and volume will gradually decrease.
Tests to the high zone of the range without volume, suggesting an absence of selling interest; except when the price is ready to initiate the movement outside the range.
Bearish shakeouts (Springs) to previous lows; either on the support area or on minor lows within the range.
Bullish movements and bars that are wider and more fluid than bearish ones. This denotes an entry of good quality demand and suggests that supply is of poor quality.
Development of rising highs and lows. This sequence should already be observed in the last stage of the range, just before initiating the bullish jump. It denotes total control by buyers.
Start of the Bullish Movement
When there is no more stock to absorb, a tipping point takes place. Control of the asset is held by strong hands and they will only dispose of their positions at much higher prices. A slight increase in demand now would cause a sharp upward movement in prices, initiating the bullish trend.
How to Identify if You're in an Accumulation Range
Not all lateral movements are accumulation ranges. To validate that you are facing a genuine accumulation, verify that ALL these criteria are met:
Preceded by significant bearish movement?
There must be a previous decline of 20-50% (stocks) or 30-70% (crypto) for it to make sense for institutions to accumulate. If the lateral comes after an uptrend, it's probably distribution, not accumulation.
Progressively decreasing volume?
Compare volume of the last Secondary Test with the initial Selling Climax. It should be at least 40-60% lower. If volume stays high or increases at each test, it is NOT accumulation, it's congestion without institutional control.
Does price quickly reject the support area?
When price falls toward the Selling Climax area, it should bounce in 1-3 candles maximum with long lower wicks. If price stays "stuck" at support for several candles without bouncing, it suggests absence of active absorption.
Do bullish tests with low volume fail without violence?
Approaches to resistance (AR) should show volume below average and soft pullbacks without violent collapses. This indicates No Supply (absence of sellers). If bullish tests generate sharp drops, aggressive supply is present.
Sufficient minimum duration to build cause?
The range must extend for at least several dozen candles to build significant cause. Accumulations lasting few candles don't generate sufficient cause and will probably produce weak rallies that fail quickly.
Validation Rule:
If all 5 criteria are met, probability of genuine accumulation = 75-85%. If 1 criterion fails = 50-60% (possible but less reliable). If 2 or more criteria fail = <40%, probably consolidation without institutional accumulation, discard trading this range.
Common Errors When Trading Accumulation Ranges
Entering during Phase B expecting it to "be ready"
You see the lateral range, identify the limits and go long at support thinking the bounce will be immediate. But Phase B can last a long time with multiple additional support tests before the Spring. Result: your position spends a long time in drawdown while price tests again and again.
Consequence: You close out of frustration just before the definitive Spring. Or worse, the Spring triggers your stop because you placed it at the SC minimum without margin for manipulation maneuvers.
Confusing any lateral consolidation with accumulation
Not every lateral movement is accumulation. Many laterals are simple pauses without real institutional absorption: flat price, flat volume (no decrease), support tests with constant volume (not decreasing), and brief ranges. These "empty consolidations" do NOT generate cause.
Consequence: You trade "accumulations" that are actually minor distributions or simple laterals without institutional intention. Price breaks downward instead of upward.
Exiting the trade out of boredom during Phase B
Accumulation is, by design, boring. Professionals WANT retailers to get bored and close their longs. If you enter after the Spring and price consolidates laterally for a long time more before the SOS, the temptation to close is enormous. "Nothing's happening, I'll get out and look for another asset with momentum."
Consequence: You close at breakeven or with small gains just before the Sign of Strength that initiates the powerful markup. Massive opportunity loss due to lack of patience. This is the most common psychological error.
Placing stop too tight at the exact Spring minimum
The Spring penetrates support. You place your stop just below thinking "if it goes lower, the structure is invalidated." Error: professionals KNOW where stops are and can do a second sweep (second shakeout) before the definitive bounce, triggering your stop.
Consequence: Stop triggered, loss, and price bounces strongly without you. You need to leave additional margin below the Spring to survive liquidity sweep maneuvers.
Not waiting for Last Point of Support (LPS) for optimal entry
You see the Sign of Strength (SOS) exit the range with volume and think "I have to enter NOW or I'll miss out." You buy at the SOS peak. But price almost always retests the broken resistance (now support) at the LPS, falling again, triggering your mental stop or leaving you in initial drawdown.
Consequence: Premature entry significantly above the optimal LPS. Your risk/reward ratio worsens drastically. You sacrifice a large part of potential due to impatience in entry.
Timeframes and Duration of Accumulation
The duration of an accumulation range varies according to the timeframe you trade. Each trading style requires structures of different temporal scale:
| Trading Style | Timeframe | Typical Duration | Expected Markup |
|---|---|---|---|
| Scalping | M1, M5 | 20-60 min | 0.5-2% |
| Day Trading | M15, H1 | 2-8 hours | 2-6% |
| Swing Trading | H4, D1 | 20-60 candles | 15-40% |
| Position Trading | D1, W1 | 60-180 candles | 50-200% |
Fundamental Rule: Cause Proportional to Effect
The longer Phase B absorption is, the greater the subsequent bullish movement. Brief accumulation ranges cannot generate large markups, they will only produce limited rallies that exhaust quickly.
If you want to capture large movements, you need to trade accumulations in high timeframes with extended durations. There are no shortcuts: cause (absorption time) determines effect (markup magnitude).
Position Management During Accumulation
When to Enter? Last Point of Support (LPS) = Ideal Entry
The optimal entry is at the Last Point of Support (LPS) after the Sign of Strength. The SOS breaks range resistance with volume (jump of +8-15%), then price returns to test the broken resistance (now support). That test is the LPS: entry with confirmation and optimal risk/reward ratio.
- • Valid signal: LPS minimum HIGHER than the last minimum before the SOS (confirmed higher low)
- • Reduced volume: 40-60% lower than SOS volume
- • Quick rejection: Bullish turn in 1-3 candles, doesn't stay "stuck" at support
Where to Place Stop Loss? Below LPS or Spring Minimum
Entry at LPS: Stop below the LPS minimum leaving sufficient margin. If price breaks the LPS downward, the structure is invalidated. Risk/reward ratio should be favorable according to the complete range projection.
Entry after Spring: Stop below the Spring minimum (NOT right at the minimum, leave margin for second liquidity sweep). Adjust stop to LPS once confirmed to reduce risk.
Take Profit Targets Based on Cause Built
Targets are NOT arbitrary. They are calculated according to cause built (range duration x range amplitude). Use these levels as reference:
- TP1: First bullish target from LPS entry. Close approximately half the position. This target is almost always reached in valid accumulations.
- TP2: Distance equivalent to range projected from resistance. If the range measured $10, project $10 from resistance. Close another significant portion of position.
- TP3: Trailing stop on rest of position. Let position run to capture complete markup which can be multiple times the range projection in large cause accumulations.
Complete Management Example:
Accumulation range: $40 (SC) - $50 (AR). Spring breaks support. SOS confirms structure. LPS retests former resistance. Entry: At LPS. Stop: Below Spring. TP1: First bullish target (close half). TP2: Complete range projection (close another portion). TP3: Trailing stop on rest until markup exhaustion.
A Classic View on the Accumulation Process
What are the conditions that need to be in place before a long and sustained bullish movement?
Stock exchange (absorption) process in an accumulation schematic
This is an important question to answer because when a stock has a larger, better and faster rise compared to other stocks, it is not a random accident.
When large informed interests determine that a company's shares will be substantially held in their portfolio, a campaign is planned. The purpose is to acquire a large number of shares at a favorable price with the expectation that the company will experience dynamic growth and push the share price to a much higher level.
Stock Exchange (Absorption) Process in an Accumulation Schematic
The initial phase of the campaign is to absorb the number of shares they are targeting. Planning is required since accumulation of the desired quantity could take many months. The goal is to buy those shares without drawing attention to their activities.
They cannot hide their actions forever and will eventually be discovered. The first big buyer will appear during the Selling Climax or shortly after, and has the greatest advantage in accumulating shares quietly.
A Selling Climax is accompanied by large quantities of shares being sold. As the accumulation phase progresses, it becomes more difficult to buy a large number of shares and requires greater trading skills.
Throughout the accumulation phase there is a large supply of shares for sale. With careful planning and execution, professionals try to absorb those shares at the lowest possible average price.
The Sentiment Paradox
As this phase evolves, more professionals will be competing for fewer and fewer shares available for sale. The paradox is that the public becomes increasingly pessimistic when prices stay low. Here is the key to the professional's strategy: keep prices low.
As the accumulation phase develops this becomes increasingly difficult to do. Wyckoff was intimately familiar with the methods professionals used and knew that their footprints could not be hidden on the chart.
Absorption is the key characteristic of the accumulation phase. The professional absorbs shares, like a sponge, at a good price/value with the intention of holding them for a long period.
The only scenario that would cause the professional to sell those absorbed shares would be much higher prices. If the Composite Operator absorbs, buys and locks up most of the available floating supply, what happens to the share price? Once the asset is in strong hands, available supply will be low and a slight increase in demand will cause the asset price to jump. The bullish trend begins. This is when the Wyckoff operator focuses on buying shares to accompany the large informed interests.
Hedge fund managers control a large amount of money in assets; there is no doubt they are the most skilled. They compete with each other to be the first to initiate campaigns and jointly allocate a large amount of capital in stocks and other asset classes.
These types of Composite Operators are also competing with other extremely skilled institutional investors (mutual funds, pension plans, ETFs). Remember, not all institutional investors are Composite Operators and not all Composite Operators are institutional investors.
The Composite Operator's goal is to absorb shares in the lower half of the accumulation range. When supply is absorbed and price begins to turn toward the ceiling of the range, the Composite Operator will stop buying and potentially sell shares near the ceiling to verify the rise. Always, in general, adding to their long position. This can last several months.
The asset is bought on weakness as price falls from the ceiling of the accumulation range to the floor. Support at the base of the range is the result of large buying activity by the Composite Operator and this can be seen in the volume spike.
A range is a battle between supply and demand. Volume increases at the top of the range suggest supply is evident, and it must be absorbed before any significant bullish trend begins.
Volume and volatility will decrease as the accumulation range develops. Many stocks develop ranges that are not actively absorbed by strong hands. These stocks will not show the attributes of accumulation and will continue in a trendless pattern for a long time.
The Composite Operator's average position price is considered to be at or below the Preliminary Support. After the bullish breakout, if price remains in the Preliminary Support zone, accumulation can be said to be being completed. If Preliminary Support is not evident, calculate the midpoint of the range.
After the stopping action, this next phase is an insufferably long period of time for the trader/investor. Volatility is high and prices are low, which guides the retail investor to capitulate by abandoning and closing their position. Meanwhile, the Composite Operator systematically uses this environment to buy stock.
Throughout all this back-and-forth action, the Wyckoff operator is patiently waiting on the sidelines until the moment when the asset is ready to begin the bullish trend.



Frequently Asked Questions About Accumulation
What is an accumulation range in the Wyckoff Method?
What is the difference between strong hands and weak hands?
What is the Law of Cause and Effect in Wyckoff?
Why do large operators manipulate price during accumulation?
What are the characteristics of an accumulation range?
How to identify when an accumulation ends?
What are the phases of Wyckoff accumulation?
Does every accumulation have a Spring?
Advanced Wyckoff Course + Volume Profile
Master the complete Wyckoff methodology combined with Volume Profile. +60 hours of content, practical exercises, and access to a trader community.
References and bibliography
Wyckoff, R.D. (1931). The Richard D. Wyckoff Method of Trading and Investing in Stocks. Wyckoff Associates.
Pruden, H. (2007). The Three Skills of Top Trading. Wiley.
Villahermosa, R. (2018). Wyckoff Methodology in Depth. Amazon KDP.
Last updated: January 2026
