The Law of Cause and Effect in Trading
How trading ranges build the foundation for trending movements

Ruben Villahermosa
Trader and Educator
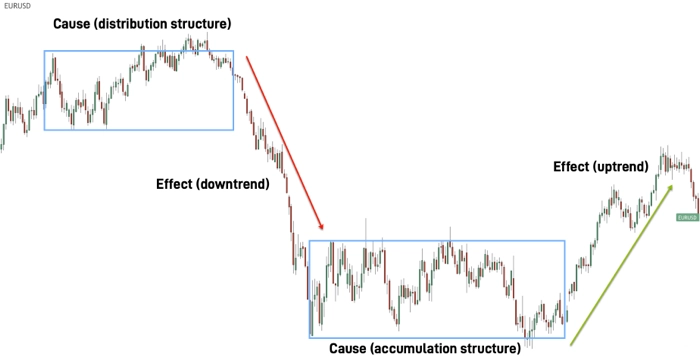
The relationship between the cause (range) and the effect (trending move)
The Law of Cause and Effect states that for a price change to occur, a cause must first be built to originate it. Causes develop during lateralization periods (ranges) through position changes between informed and uninformed operators. The effect (trending move) is proportional to the cause: big cause = big effect. Point and figure charts allow measuring the cause and projecting price targets. The cycle is continuous: trend ends → cause begins → cause ends → trend begins.
The Law of Cause and Effect is one of the three basic laws that Richard Wyckoff introduced in financial markets. This law tells us that for there to be an effect, there must first be a cause that originates it.
The Law of Cause and Effect in Financial Markets
Fundamental Principle
The idea is that nothing can happen out of nothing; that to see a change in price, a cause must first be built to originate it.
Generally, causes are built through an important change of hands between well-informed operators and those who are not.
In the case of individual operations, the cause that makes the price rise is the buyer's desire to want those shares or the seller's desire to want that money.
In addition to seeing the cause in terms of an individual operation, the objective is to see the cause from a broader perspective, in terms of movements. For this, it is said that the market is building a cause during periods of price lateralization; and that these subsequently generate an upward or downward trending movement as an effect.
Videos in Spanish with English subtitles available


Stock Absorption Campaigns
During these lateralization periods, stock absorption campaigns are carried out in which large operators begin to position themselves on the right side of the market, gradually expelling other participants until they find the path in which the price will move free of resistance.
An important aspect of this law is that the effect produced by the cause will always be in direct proportion to that cause. Consequently, a large cause will produce a greater effect, and a small cause will result in a smaller effect.
It is logical to think that the longer the market spends in a range condition developing a campaign, the greater the distance the subsequent trending movement will travel.
"The key is to understand that it is during the lateral phases of price where accumulation/distribution processes develop."
- Wyckoff Methodology
Depending on its duration and the efforts we see during its formation (manipulation maneuvers such as shakeouts), this cause will provoke an upward or downward response movement (effect).
Elements to Consider
Climactic Events
Certain market conditions exist, such as climactic events, which can cause a sharp price reversal without significant prior preparation.
Large operators use these climactic candles to accumulate/distribute all the stock they need without developing a more extensive campaign and start the expected movement from there.
Important
Not all ranges are accumulation or distribution processes. This point is very important. Remember that the methodology tells us that there will be structures that are simply price fluctuations and nothing more, and they do not have a cause that motivates them.
Point and Figure Charts
In principle, the projection of the effect will be unknown, but we can consider it proportional to the effort that caused it.
Wyckoff used the point and figure chart to quantify the cause and estimate the effect.
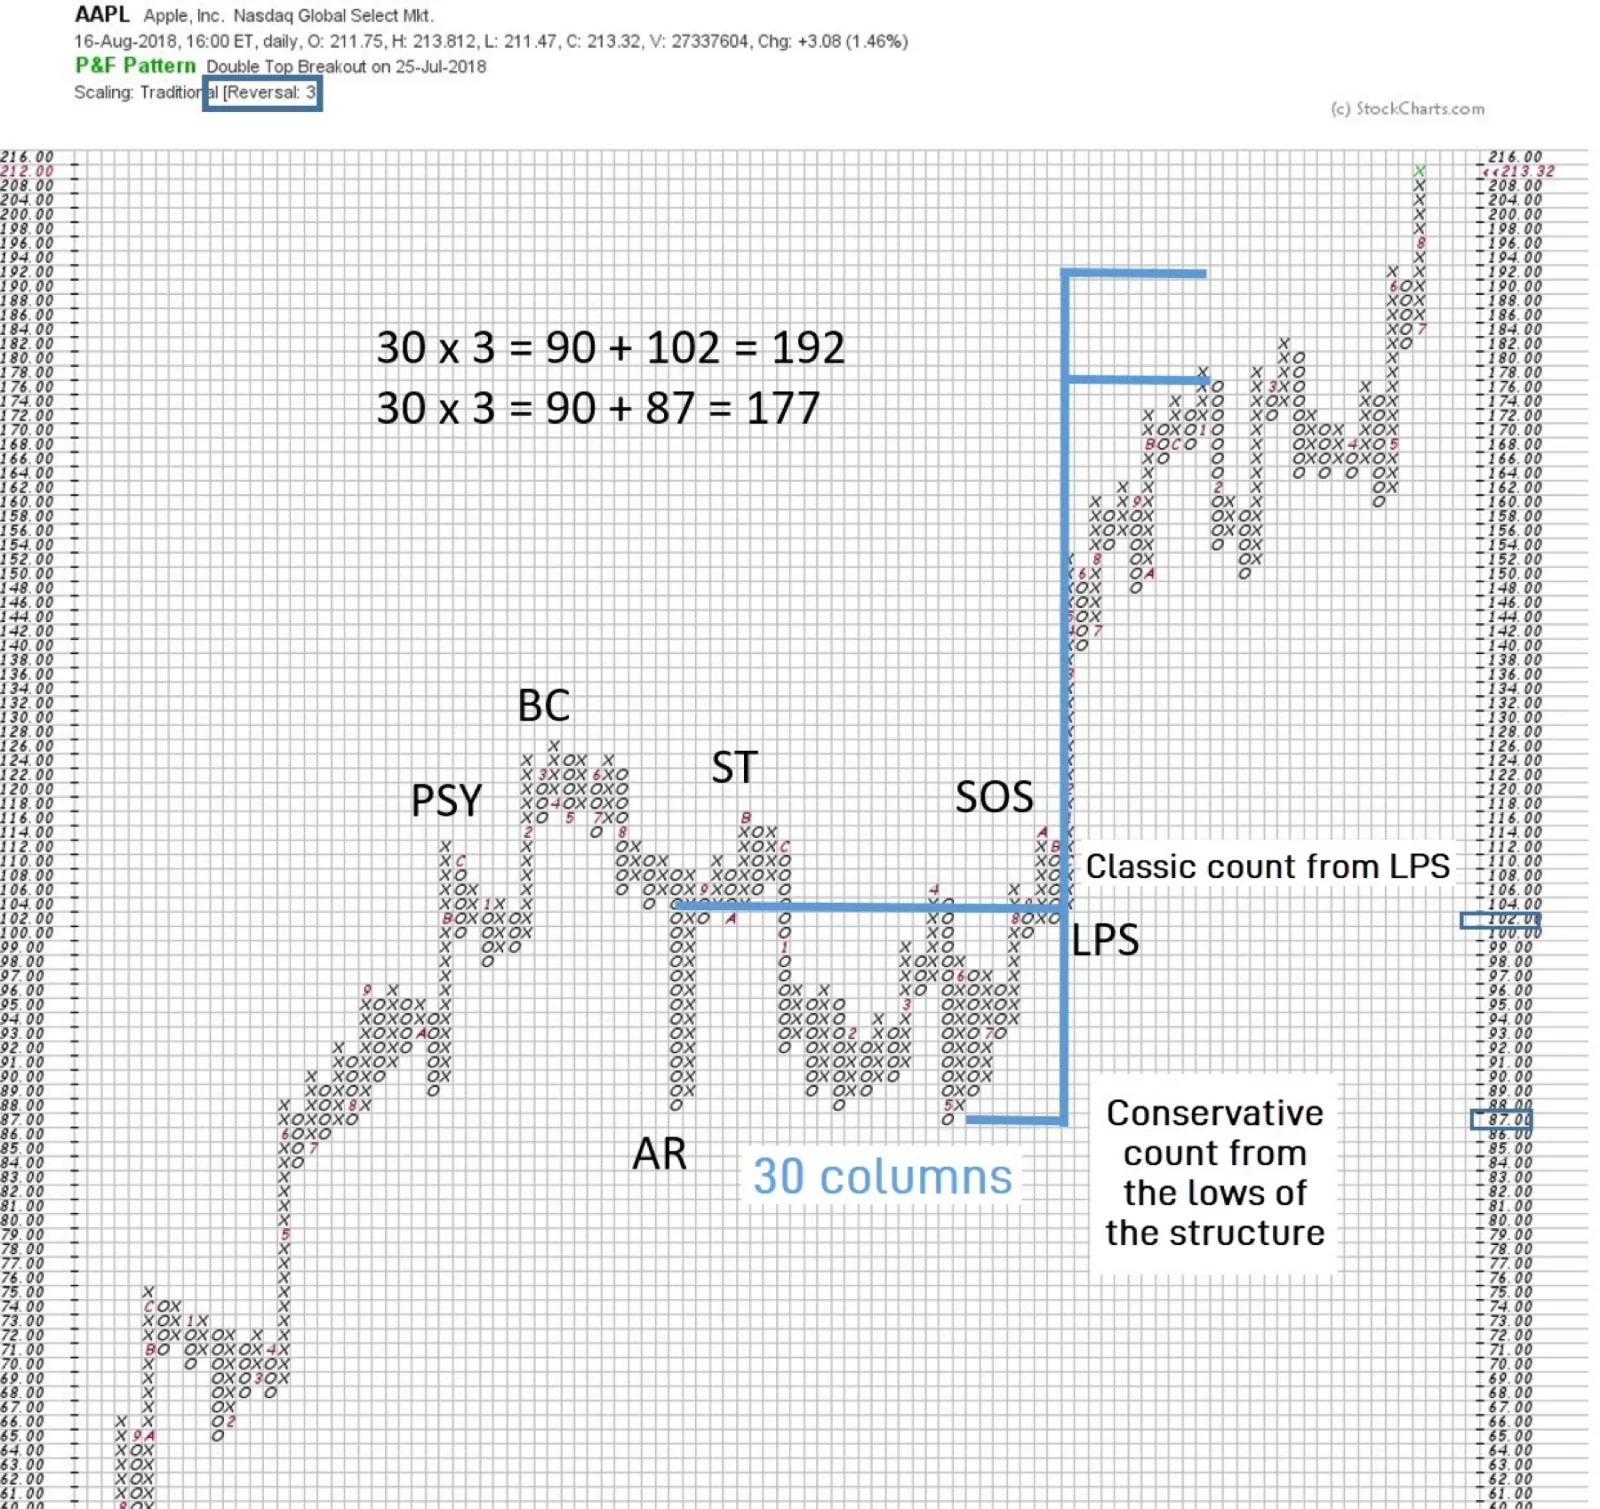
Through horizontal column counting, possible targets are estimated. It provides a good indication of how far a move can go. Accumulation would produce an upward count while distribution would project it downward.
Distinctive Feature
Unlike bar charts, which are based on time; point and figure charts are based on volatility. For the chart to advance to the right and generate a new column, it first requires a price movement in the opposite direction.
Counting Methodology
The count on this type of chart is performed from right to left and is delimited between the two levels where the force controlling the market at that moment appeared first and last:
For Accumulation Schemes
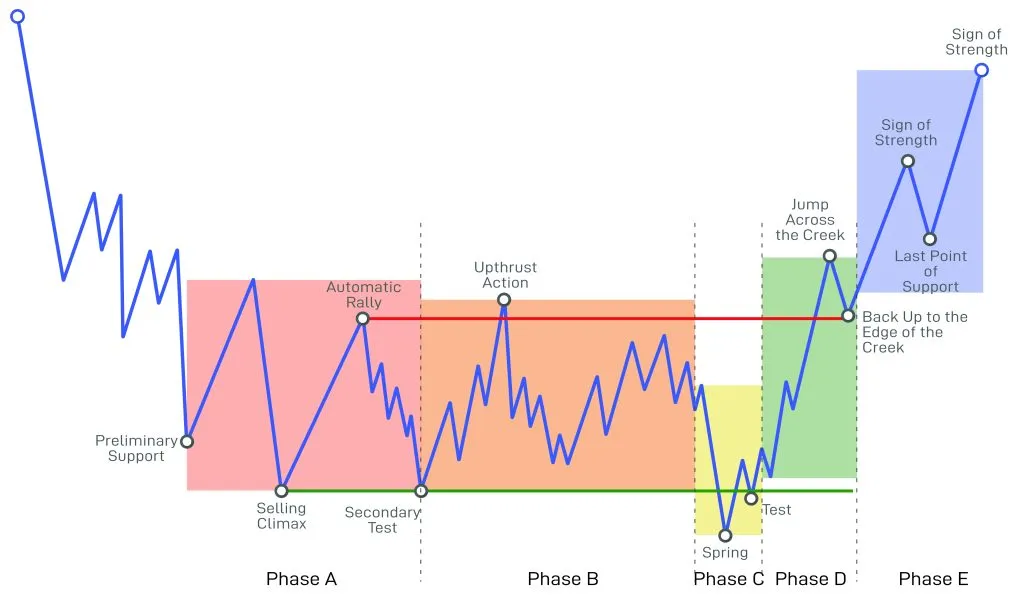
We measure the number of columns between the Last Point of Support (last event where demand appeared) and the Preliminary Support or Selling Climax (first events of demand appearance).
For Distribution Schemes
We measure the number of columns between the Last Point of Supply (last event where supply appeared) and the Preliminary Supply or Buying Climax (first events of supply appearance).
For Re-accumulation Ranges
The count is made from the Last Point of Support to the Automatic Reaction (since this is the first event where demand appeared).
For Re-distribution Ranges
The count is made from the Last Point of Supply to the Automatic Rally (first event where supply appeared).
After counting the number of boxes that form the range, the result is multiplied by the box value.
Types of Projections
Projection Methods
- Classic projection: The resulting figure is added to the price at which the LPS/LPSY occurs.
- Moderate projection: The resulting figure is added to the price of the highest extreme reached.
- Conservative projection: The area is divided into phases, performing independent counts from and to where price turns occur.
In distribution ranges, the highest maximum will generally be the one established by the Upthrust (UT) or the Buying Climax (BC). For accumulation ranges, the lowest minimum will generally be that of the Spring (SP) or the Selling Climax (SC).
Important Consideration
Just because a stock has extensive preparation does not mean that the entire area is accumulation or distribution. This is why counts made using point and figure charts do not always reach the longest-range target, and therefore it is suggested to divide the range to generate several counts and establish different targets.
Technical Analysis for Target Projection
There are traders who consider that target projection through point and figure chart counting is impractical in today's markets.
Point and Figure Problematic
There is also a problem with point and figure when it comes to its creation since there are various ways to do it. This reduces its usefulness from my point of view since that subjectivity makes me lose confidence in said tool.
Some prefer to simplify it and use tools like Fibonacci, Elliott, or harmonic patterns (vertical projection of the range) for target projection.
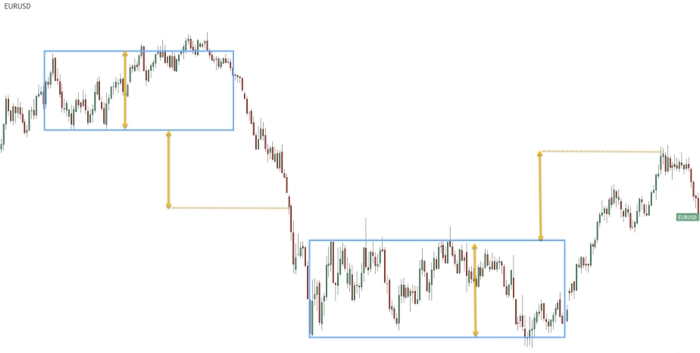
These types of tools are gaining more and more strength since the inclusion of computer programs in financial markets. Many algorithms are programmed under these simple premises and therefore are targets that are met with high probability.
Conclusion
Since the market moves under this law of cause and effect, using lateral phases to generate subsequent movements; I consider that it can give us an advantage to try to decipher what is being "cooked" during the development of these structures.
And to try to decipher what is happening there, the Wyckoff methodology offers us excellent tools.
Wyckoff traders know that it is in these lateral conditions where movements are born, and this is why we are continuously searching for the beginning of new structures to start analyzing price action and volume with the objective of positioning ourselves before the development of the trending movement.
"A trend will end and a cause will begin. A cause will end and a trend will begin. The Wyckoff method is centered around the interpretation of those conditions."
- Wyckoff Methodology
Wyckoff In Depth
This article is an excerpt from the book. If you want to master the law of cause and effect and learn to project targets with precision, the book provides you with all the necessary knowledge with supporting charts and practical examples.
View book