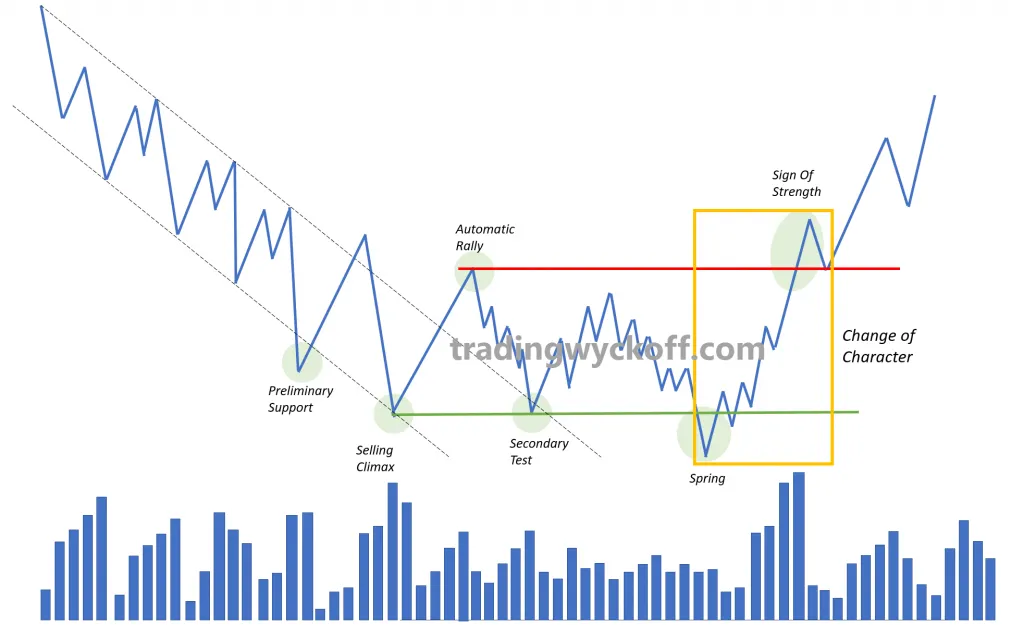
Last Point of Support (LPS)
The final confirmation that validates the breakout and offers the best low-risk entry opportunity in Wyckoff structures.

Rubén Villahermosa
Trader and educator
Article Summary
The Last Point of Support (LPS) is the immediate action that precedes a Sign of Strength: the last failed attempt by sellers to push prices lower before aggressive buying interest emerges, creating a higher low. It can appear after shakeout, within the range, or outside (after breakout). The confirmation test shows: narrow range candles, low volume, price staying outside the range. High volume on the test indicates caution - possible shakeout instead of genuine breakout.
When the breakout event appears, it is only "potential" since the confirmation comes from its test. Just like with shakeouts, signals of strength (Sign of Strength) or weakness (Sign of Weakness) need to be tested.
If we have a successful test, we are now in a position to label the previous movement with greater confidence, and this last one, its test, is the confirmation event. That is, the test will confirm whether or not we are facing a true intentional movement.
In terms of the methodology, just as the bullish breakout movement is labeled as Sign of Strength (SOS) or Jump Across the Creek (JAC), the pullback movement that confirms the breakout is labeled as Last Point of Support (LPS) or Back Up to the Edge of the Creek (BUEC).
For the bearish example, the breakout is caused by a sign of weakness (Sign of Weakness - SOW) and the pullback movement that would confirm it is labeled as Last Point of Supply (LPSY) or Fall Through the Ice (FTI), although this last term is less known. Remember that the Ice is the support zone in the structures and this term comes from an analogy similar to that of the Creek.
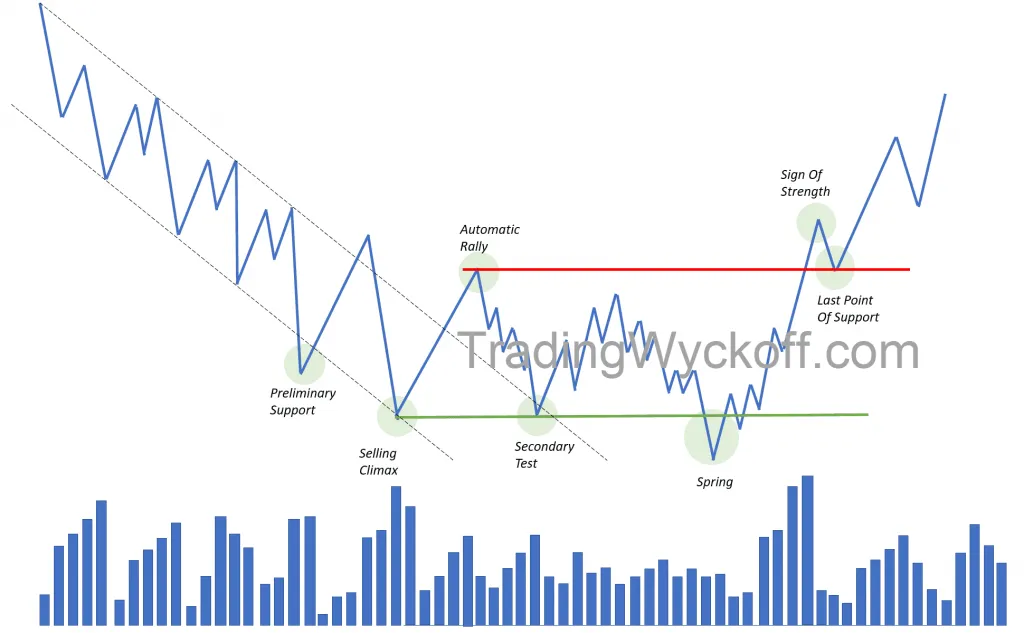
But how can we know if we can expect the confirmation event? Obviously we cannot know. It's about adding up clues that give a higher probability to one scenario occurring instead of the opposite.
To wait for the confirmation test, we first want to see that price makes an impulsive movement, evidenced by an expansion in price ranges and an increase in traded volume. At this point our main scenario should be to wait for a pullback movement to look for a trading opportunity.
How Confirmation Appears on the Chart
As we have already mentioned, this is the most delicate moment because it is about examining whether we are facing a potential breakout event or a shakeout.
In this confirmation action we look for exactly what was explained about breakout events:
- That the market travels a significant distance in the breakout movement
- That the test movement does so with narrow range candles, intertwined and with low volume
- That the price does not re-enter the range
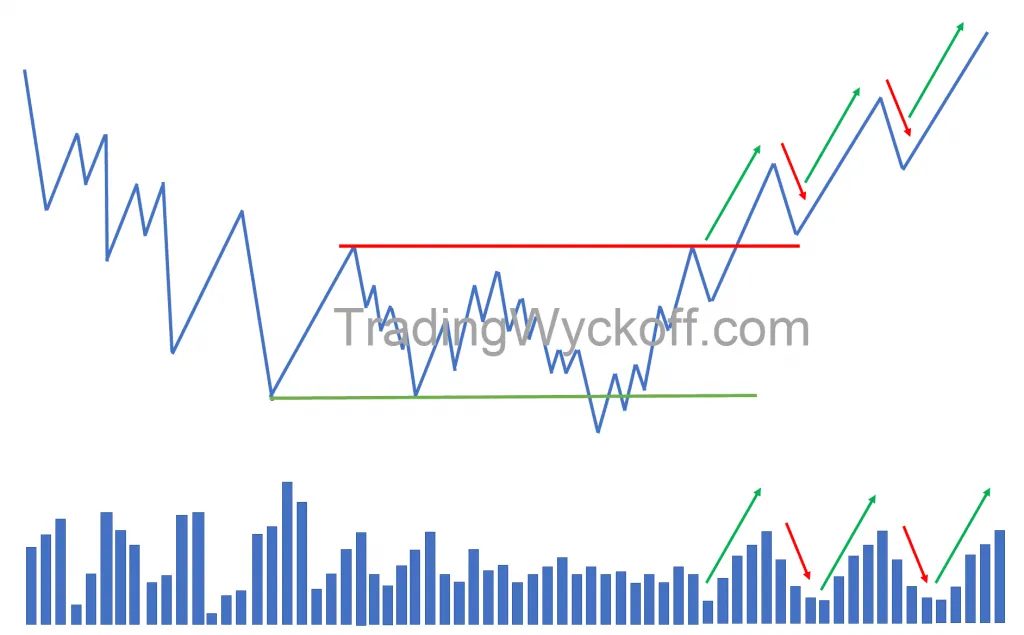
As we have seen, the breakout movement will give us greater confidence if it is accompanied by an increase in price ranges and volume; likewise, we want to see that the pullback movement that will test the broken structure is accompanied by a decrease in price ranges and volume in comparative terms.
Fundamental Rule
This is the natural action for all movements that make up a trend: impulsive movements that show intentionality and corrective movements that denote lack of interest.
Warning Signal After Breakout
Attention to Volume
If there is relatively high volume on the confirmation test, the most convenient thing is to proceed with caution since that volume tells us that there is latent interest toward that direction.
And as we know, the large operator will not initiate the expected movement until having ensured that the path is free of resistance. Therefore, we should expect successive tests to develop on the zone.
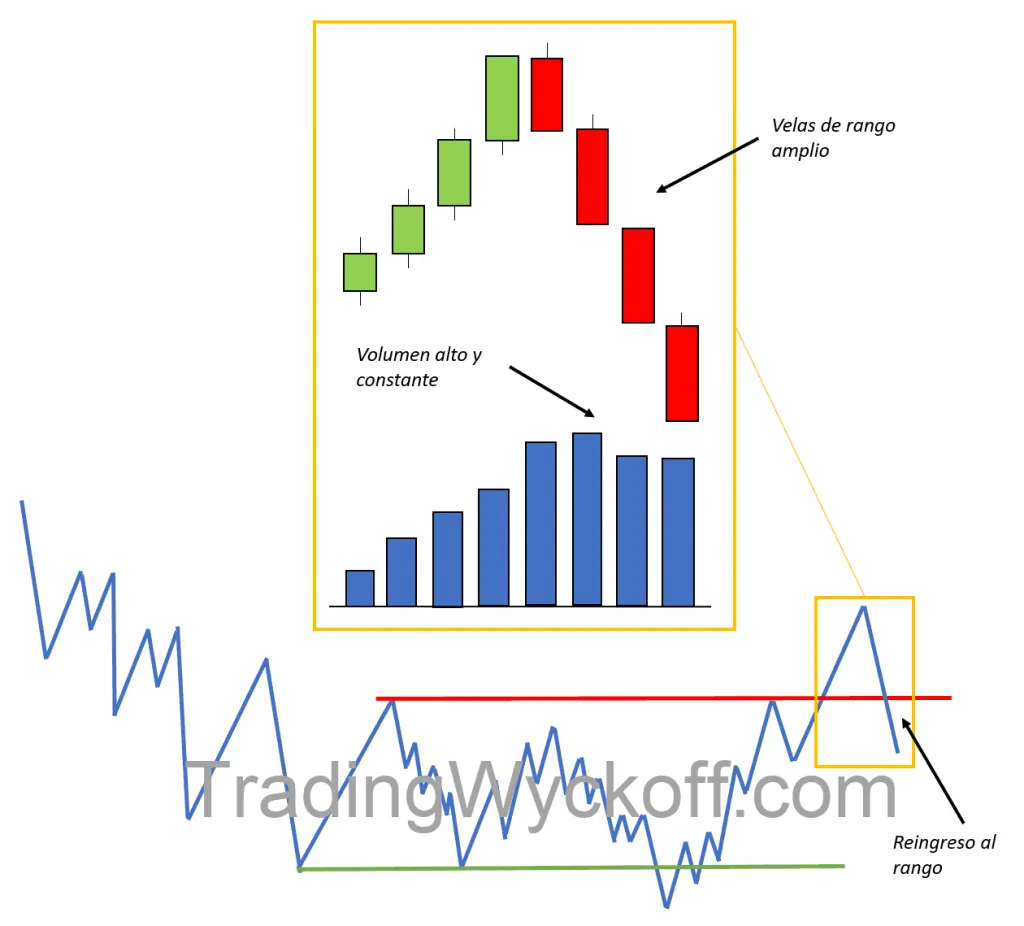
A corrective movement with wide price ranges and high volume cancels the probability that the first movement was a breakout and most likely at this point the price will re-enter the range leaving the potential breakout finally as a shakeout.
Trading Opportunity
This confirmation event appears in an ideal location to enter the market or to add to an open position.
"Originally this was the preferred position by Richard Wyckoff to enter the market because in our favor we have identified all the price action to our left where we can see the effort of the professionals to carry out an accumulation or distribution campaign and therefore offers us an opportunity with a relatively lower risk."
- Richard Wyckoff
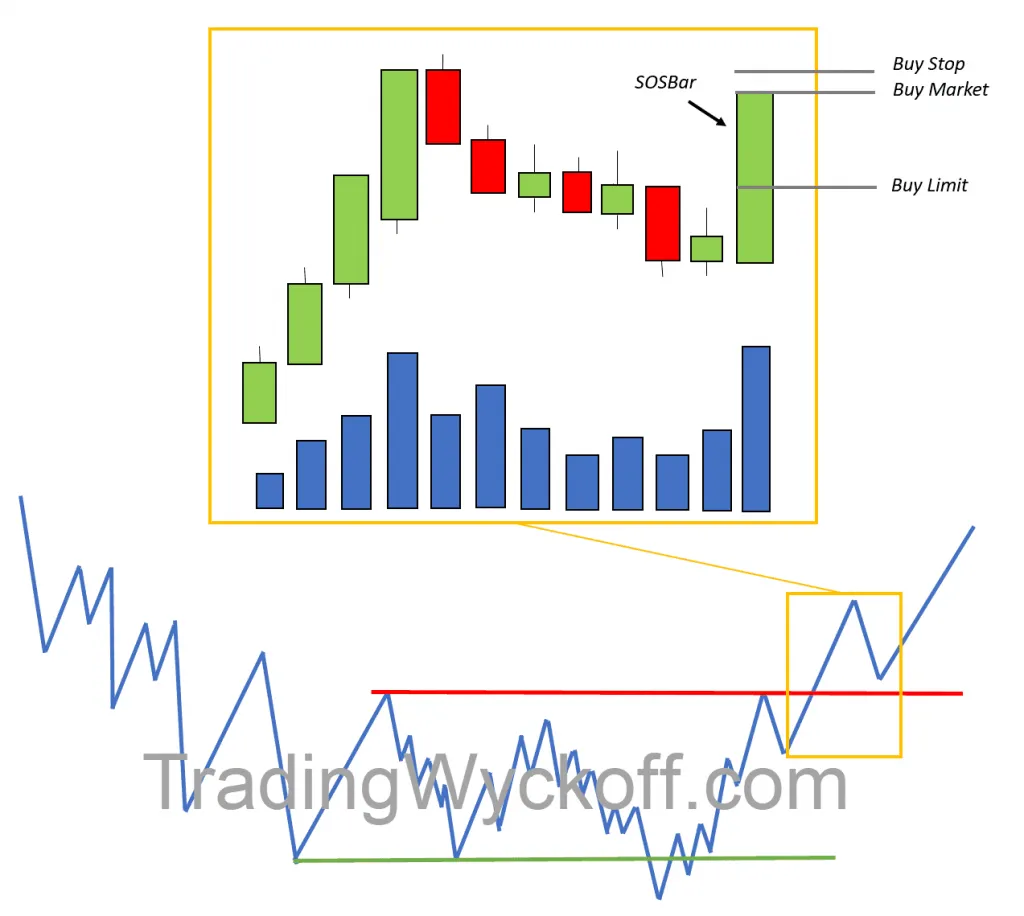
To Buy (Accumulation Structures)
A good option would be to wait for a strength candle (SOSbar) to appear and place a market entry order, or a stop order to break the candle, or even a limit buy order at a certain level waiting for the price to pull back to it.
Stop Loss Management - Buy
Place or move the stop loss of the entire position below the Last Point of Support and the broken resistance line (Creek).
To Sell (Distribution Structures)
Wait for a good weakness candle (SOWbar) to appear and enter the market using the order that best suits your personality as a trader.
Stop Loss Management - Sell
Place or move the stop loss above the Last Point of Supply and the broken support line (Ice).
Video in Spanish with English subtitles available

Quantifying the Entry Trigger
Unfortunately all discretionary approaches by their very nature have a major disadvantage due to the subjectivity required when performing analyses and proposing scenarios.
This subjectivity is what causes methods with real underlying logic like the Wyckoff methodology to not be winners in the hands of all traders.
As you have probably already read somewhere else, it is considered that human participation within a trading strategy is undoubtedly the weakest link, and this is obviously due to the emotional aspect that governs us.
To mitigate this, many recommend trying to objectify your trading strategy as much as possible. But this is not an easy task, much less for Wyckoff traders. The elements to take into account when proposing scenarios are so many that it would seem impossible to create a strategy with 100% objective rules that always operates the same way.
Practical Solution
A solution that is in our hands is to try to quantify the trigger we will use to enter the market. It is undoubtedly a simple measure that can help us incorporate some objectivity to our strategy.
If You Trade Only with Price
You might want to quantify what happens when a certain price pattern appears. For example, to buy, we could quantify a simple price reversal consisting of a bearish candle followed by another bullish candle. And from there we can complicate it as much as we want:
- Add that some moving average is below the price
- That the second bullish candle be greater than a specific number of pips
- Use a buy stop order to break the candle
If You Trade with Volume Tools
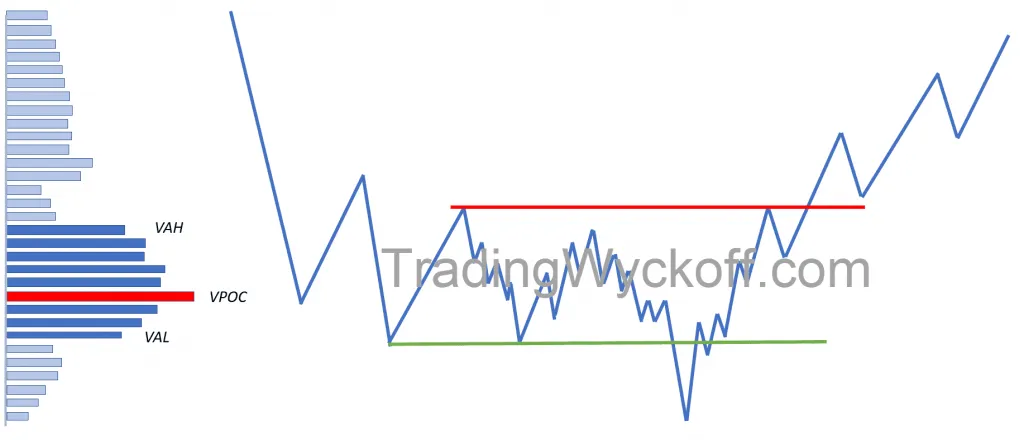
You might want to add other variables such as:
- That price is above the POC (Point of Control)
- That it is above VAH (Value Area High), VAL (Value Area Low) or VWAP
- That the bullish candle is accompanied by a significant increase in Delta (Difference between Bid and Ask)
The options are infinite, from the simplest to the most complex; the only limit is your creativity. Of course, this is arduous work since if you don't know how to do it through code (programming a robot), you'll have to do it by hand and this will require a lot of time.
Also, when doing a Backtest you have to take into account other aspects such as data quality, commission expenses (spreads, commission, swap), latency problems (slippage), as well as other points concerning strategy optimization.
Last Point of Support
LPS Definition
The Last Point of Support (LPS) is the immediate action that precedes a Sign of Strength (SOS). It is an attempt by sellers to push the price lower but that fails when buyers appear aggressively, giving rise to a new bullish impulse.
Based on the movement that precedes the Last Point of Support, we can find different types:
LPS After Shakeout
In case the price comes from developing a Spring/Shakeout, the Last Point of Support would be the tests of those two events. Better risk/reward ratio.
LPS Within the Range
If the price comes from developing a Sign of Strength, the Last Point of Support will appear on the bearish pullback during Phases B/C.
LPS Outside the Range
Here we have on one hand the test movement after the breakout (the Back Up to the Edge of the Creek - BUEC); and on the other hand all the pullbacks we find during the bullish trend phase outside the range.
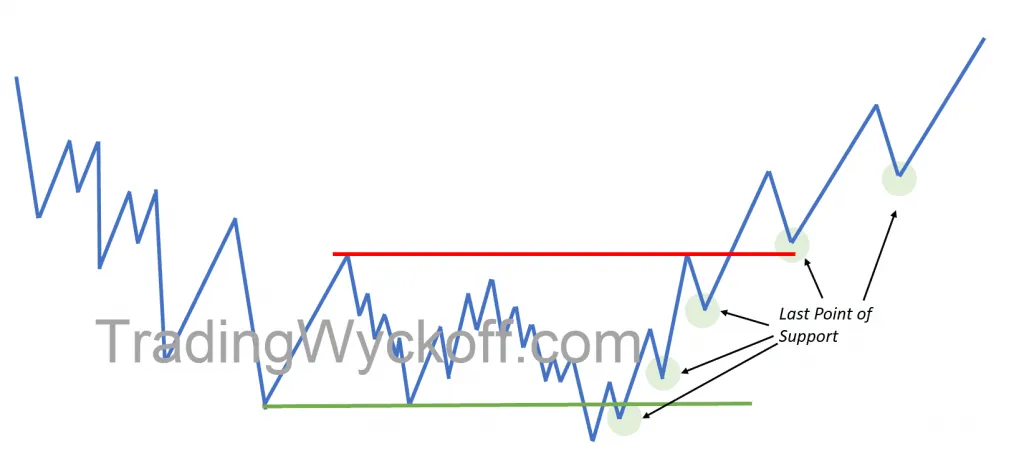
As we know that the market moves in waves; after the bullish impulse (Sign of Strength) we expect a bearish pullback (Last Point of Support). This pullback is the last support point for demand.
It is a price point where buyers appear to stop the decline, generating a higher low. This higher low is a stop before starting a new impulsive movement upward.
Common Mistake
Many traders guided by their lack of understanding will be buying during the development of the strength signal (SOS). But this action is not correct, the most recommended thing is to wait for the next reaction (LPS) to start looking for an entry trigger to the market at that point.
Sometimes the Last Point of Support will occur at the same price level where the Preliminary Support appeared since that is where the large operators began to buy the asset.
Last Point of Supply
LPSY Definition
The Last Point of Supply (LPSY) is the immediate action that precedes a Sign of Weakness (SOW). It is an attempt by price to rise but is blocked by large sellers, who are already positioned short and appear again to protect their positions.
Based on the movement that precedes the Last Point of Supply, we can find different types:
LPSY After Shakeout
In case the price comes from developing an Uptrust After Distribution (UTAD), the Last Point of Supply would be its test.
LPSY Within the Range
If the price comes from developing a Sign of Weakness, the Last Point of Supply will appear on the bullish pullback within the distribution range.
LPSY Outside the Range
Here we have the test movement after the breakout (the Fall Through the Ice - FTI); and all the pullbacks we find during the bearish trend phase outside the range.
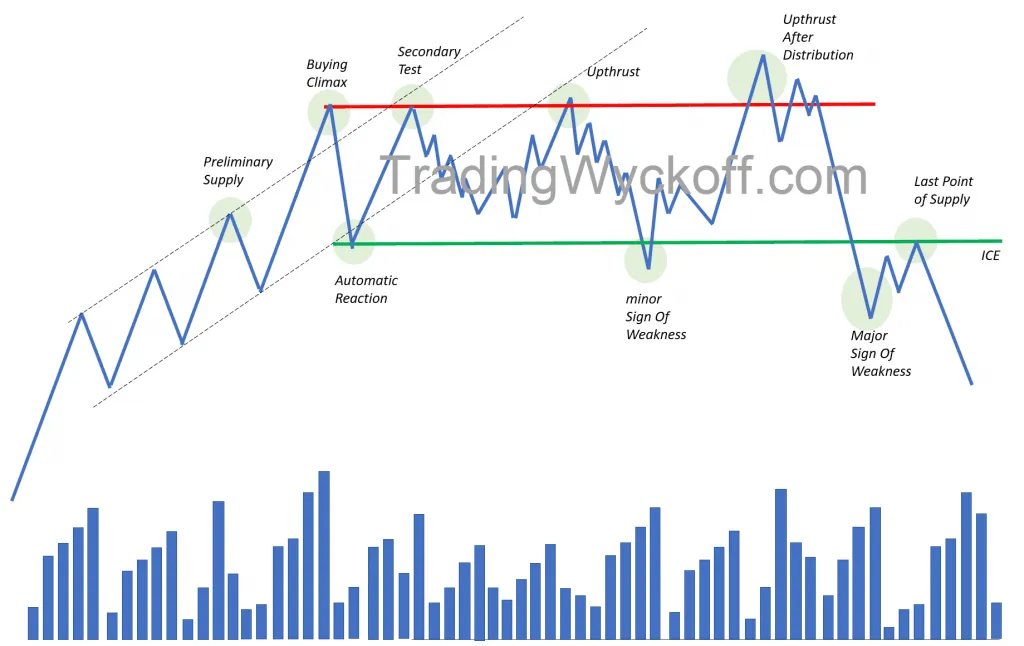
After breaking the Ice (support) with a show of weakness (Sign Of Weakness), we want to see a bullish movement with narrow price ranges, which would denote the market's difficulty in continuing to rise.
Preferably we will expect the volume to be low, indicating lack of interest by buyers; but you have to be attentive because a high volume could signal an increase in seller interest to go short in that zone.
The Last Points of Supply are good places to initiate or add short positions since they are the last waves of distribution before a new bearish impulse begins.
The price reached at the Last Point of Supply sometimes coincides with the level where the Preliminary Supply appeared. This is because, if the structure is distributive, it is on the Preliminary Supply where the distribution initially began.

Wyckoff Methodology in Depth
This article is an excerpt from the book. If you want to master the LPS, LPSY and all the operational zones of the Wyckoff methodology, the book provides all the necessary knowledge with detailed support charts.
View book