Market Makers & Counterparty: How the S&P 500 Works
Who takes the other side of your order in the ES, how market makers hedge, why SPX, ES and SPY all exist, how the opening and closing auctions work — and what happens when liquidity disappears

Ruben Villahermosa
Trader and Educator

Your order in the S&P 500 futures (ES) is matched against resting limit orders in CME's central order book, many of them from market makers, and CME Clearing then steps in as the legal counterparty. Market makers don't bet on direction: they earn the spread and neutralise their risk with futures, stock baskets or SPY. When the risk becomes unmanageable they pull back, as in the 2010 Flash Crash, and the market's circuit breakers kick in.
Every time you hit buy on S&P 500 futures, someone sells to you. It sounds obvious, but ask ten traders who that someone is and you'll get ten different answers: "the broker", "the banks", "the smart money", "the market maker coming for my stop".
Most of those answers are wrong, or at best incomplete. And it isn't an academic detail: understanding who takes the other side, what they do with the risk they buy from you and why they sometimes disappear changes how you read volume, how you interpret wide-range bars and what you should expect from the market on specific days such as quarterly expiration.
In this article I follow the full journey of an order through the S&P 500 ecosystem: the order book, market makers, their hedges, the relationship between the index, the future and the ETF, the opening and closing auctions, and what happens when all of that breaks. Every figure has been checked against official sources (CME, NYSE, Nasdaq, Cboe, SEC and CFTC), linked throughout the text.
What you'll learn
- • Who your real counterparty is in the ES and why the clearing house removes default risk
- • What obligations market makers have and how they make money without betting on direction
- • How they hedge: delta hedging in options, stock baskets, SPY and futures
- • Why SPX, ES and SPY all exist at the same time, and how arbitrage ties them together
- • How the opening and closing auctions work, and how the ES settles and expires
- • What really happened in the 2010 Flash Crash and which safeguards exist today
Table of Contents
Who is really on the other side of your trade
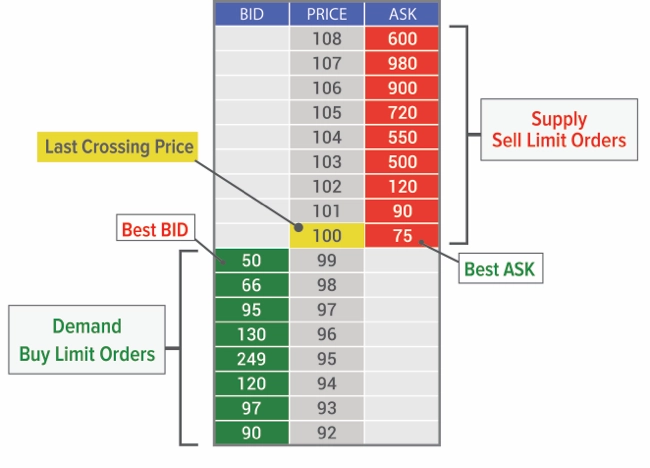
The E-mini S&P 500 future (ticker ES) trades on CME Globex, the Chicago Mercantile Exchange's electronic platform. There is no assigned specialist and no desk deciding what price you get: there is a central limit order book where every resting buy order (bid) and sell order (ask) sits, ranked by price and, within each price, by time of arrival.
What is a specialist, and where do they still exist?
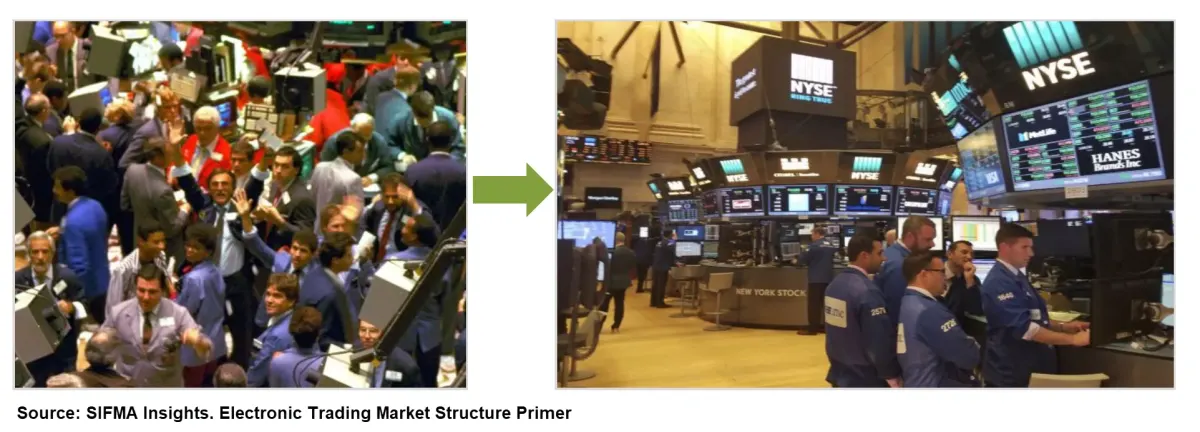
For more than a century, every stock on the New York Stock Exchange (NYSE) had an assigned specialist: a single floor intermediary responsible for keeping trading in that stock orderly. The specialist matched orders, ran the open and the close, and committed their own capital when the other side was missing. In 2008 NYSE replaced that role with the Designated Market Maker (DMM), who is still assigned specific stocks with an obligation to maintain a fair and orderly market (SEC, 2008). DMMs remain central to the opening and closing auctions, as you'll see below. Nasdaq never had specialists: several market makers compete in each stock. And futures have nothing similar: nobody is assigned to the ES. What exists are voluntary market maker programmes with incentives, which I explain in the next section.
Two types of participants interact in that book, and the distinction is the foundation of everything that follows:
- Passive participants leave limit orders in the book. They provide liquidity and wait for someone to trade against them.
- Aggressive participants send market orders (or limit orders that cross the spread). They consume liquidity. They are in a hurry and accept whatever price is available.
When you buy at market, your counterparty is whoever had the resting sell order at the best ask. It could be a fund, a speculator, an arbitrage algorithm or a market maker. You don't choose who you trade against, and the book doesn't tell you: the market is anonymous.
The legal counterparty: the clearing house
Once your trade is matched, CME Clearing steps in between the two sides through a process called novation: it becomes the buyer to every seller and the seller to every buyer (CME Group). If the other side goes bust, the clearing house stands behind the contract. That is why there is no counterparty risk in futures in the classic sense, and why margins exist: they are the cushion the clearing house uses to protect itself.
This alone clears up a common confusion. In a centralised market like futures, your broker is not your counterparty: it only routes your order. It's different in OTC markets (spot Forex, CFDs), where a market-making broker can indeed sit on the other side of your trade; I explain that in detail in today's trading ecosystem.
What if you trade stocks with a retail broker?
With stocks the answer changes. In the United States, most retail orders never reach an exchange: according to the SEC, retail brokers route more than 90% of their customers' marketable orders to a small group of wholesalers, who execute them internally against their own account (SEC, 2022). The broker is often paid for sending them: that's payment for order flow. The wholesaler wants that flow precisely because it is uninformed flow (more on that shortly). In the European Union the practice is banned: the ban has applied since 2024 and, once the last transitional period available to some countries ran out, it has applied without exceptions since 1 July 2026 (A&O Shearman). None of this applies to futures: every order goes to CME's central order book.
Who market makers are and how they make money
A market maker is a participant that keeps buy and sell orders in the book at the same time, continuously. Its goal isn't to guess whether the market goes up or down, but to earn the difference between the price it buys at and the price it sells at: the spread.
In the ES, that role is played mainly by algorithmic and high-frequency trading firms, together with the desks of large banks. CME doesn't publish who they are. What it does publish are the terms of its market maker programmes, which work like a contract:
- ✓An obligation to quote both sides continuously for a minimum percentage of the session
- ✓A maximum spread between their bid and their ask
- ✓A minimum number of contracts on each quote
- ✓In exchange: predetermined incentives, usually discounts on fees or on messaging limits
- ✓Selection by the exchange and a private agreement: participants' names are not public
For example, the market maker programme for S&P 500 factor futures approved in September 2026 follows exactly that structure (CME filing with the CFTC). The specific figures vary by product and over time, but the logic is always the same: the exchange pays for liquidity through fee discounts.
The key point: the obligation is to be present with reasonable prices, not to absorb unlimited losses. No programme requires a market maker to stand still while the market moves against it. That explains everything you'll see in the Flash Crash section.
The business: spread versus inventory
Imagine a market maker quoting the ES at 6,700.00 / 6,700.25. If someone sells to it at market and someone else buys from it at market shortly after, it has earned one tick ($12.50 per contract) without taking a directional view. Multiplied by millions of trades, it's a huge business built on tiny margins.
The problem appears when orders don't arrive balanced. If people only sell to it, it builds up long inventory, and if the price keeps falling, that inventory loses value faster than the spread can make up for. That's why its absolute priority, as soon as it builds up a position, is to get rid of it or hedge it.
The real enemy: informed flow
Academic market microstructure has been explaining a market maker's real risk for decades. The models of Kyle (1985) and Glosten and Milgrom (1985) formalised it: whoever provides liquidity trades against two kinds of flow.
- Uninformed flow: orders that don't anticipate the future price (rebalancing, hedging, retail trades). Buys and sells tend to offset each other, and the market maker collects its spread comfortably.
- Informed flow: orders from someone who knows, or estimates better, where the price is going. That flow is persistent and one-directional, and the market maker taking the other side ends up systematically on the losing end.
Since the market maker can't tell in advance which order is informed, it widens the spread to compensate for that risk (adverse selection). And when it detects that the flow has become clearly one-directional, what the industry calls toxic flow, it defends itself: it widens even further or pulls out. This concept is, by the way, the rigorous version of the idea of "strong hands and weak hands", and I'll develop it in a dedicated article on liquidity.
How they protect themselves: hedging, delta and baskets
A market maker doesn't want a directional view. When it builds up a position, it neutralises it by trading another correlated instrument. In the S&P 500 ecosystem it has three main tools.
1. Hedging with the future or the ETF
The fastest option. If a dealer has bought a portfolio of large index stocks from a client who wanted out, it sells ES or SPY to stay neutral. If it has sold futures to a fund, it buys SPY or the stock basket. The instrument depends on which is cheaper and more liquid at that moment.
2. Hedging with the stock basket (basket trading)
This raises a logical question: does anyone really buy or sell all 500 stocks at once? Yes, and it's been routine on Wall Street since the 1980s. It isn't done by hand: an algorithm sends a basket with each stock in proportion to its index weight (a lot of Apple, Microsoft or Nvidia, and small amounts of the smallest companies).
NYSE historically called this program trading and defined it as index arbitrage or the purchase or sale of a basket of 15 or more stocks with a total value of $1 million or more (Federal Register, 2007). For a firm with the right technology, sending 500 coordinated orders is no harder than sending one.
3. Delta hedging in options
In options the risk is far more complex, because it isn't linear. If a dealer sells a call, it gains if the market falls and loses if it rises, but the intensity of that loss changes as the price moves.
Delta: how much the option moves per point of the underlying
A call with a delta of 0.40 behaves, for small moves, like 0.40 units of the underlying. The dealer who sold it buys that amount of futures (or SPY) to stay neutral. That's delta hedging.
Gamma: how much the delta changes when the price moves
If the market rises, the delta of the short call increases (say from 0.40 to 0.55) and the dealer has to buy more futures to stay hedged. If it falls, it has to sell. The hedge isn't set once: it's adjusted continuously.
The effect on the future: order flow generated by hedging
When dealers are short gamma (net sellers of options), their adjustments go with the move: they buy as it rises and sell as it falls, and can amplify it. When they are long gamma, the opposite happens and they tend to dampen it. That flow reaches the ES with no speculative intent behind it.
This mechanism has gained a lot of weight with same-day expiry options (0DTE). According to Cboe, options expiring the same day reached 66.2% of SPX options volume in July 2026 (Cboe). They are options with very high gamma near the price, which forces hedges to be adjusted very frequently throughout the session.
The chain of dependence
Options market makers depend on being able to trade the underlying to hedge. If the futures book empties out, they can't adjust their hedge, and the logical reaction is to pull or widen their options quotes. Options liquidity rests on futures liquidity. It doesn't switch off in an instant, but the contagion between the two markets is direct.
SPX, ES and SPY: three faces of the same index
If the S&P 500 is just the weighted average of its 500 components, why is there a future and an ETF trading separately? Because you can't buy the index. SPX is a calculation: a number published by S&P Dow Jones Indices from the prices of the stocks. To "buy the index" you'd have to buy all 500 stocks in their exact proportions. The future and the ETF exist to solve that problem, each in its own way.
| Feature | SPX | ES | SPY |
|---|---|---|---|
| What it is | The index: a calculation | CME E-mini future | ETF tracking the index |
| Can you buy it? | No (only its options) | Yes, on margin | Yes, like a stock |
| Hours | Calculated 9:30 a.m. to 4:00 p.m. ET | Sunday 6:00 p.m. to Friday 5:00 p.m. ET, daily break 5:00-6:00 p.m. | Regular stock market hours, plus pre-market and after-hours |
| Size | — | $50 × index (tick 0.25 = $12.50) | Approx. 1/10 of the index per share |
| Its options | European, cash-settled (Cboe) | Options on futures (CME) | American, physical delivery of shares |
| Who uses it | Large portfolio hedges and 0DTE | Funds, CTAs, quick hedges, round-the-clock trading | Financial advisers, asset managers, accounts without futures access |
The ES specifications come from CME. To get a sense of the leverage: with SPX around 7,600-7,700 points at the end of summer 2026, a single ES contract is worth roughly $380,000 of exposure, against a maintenance margin of a little over $20,000 (CME reviews it periodically, so always check the current figure). That's why there's also the Micro E-mini (MES), one tenth of the ES.
Why an institution chooses one or the other
The future solves three problems the stock basket doesn't:
- Hours: news doesn't wait for New York to open. The ES trades almost 23 hours a day, and it's where S&P 500 risk changes hands during the Asian and European sessions.
- Capital efficiency: you post margin, not the full value of the position.
- Speed and cost: selling hundreds of millions of dollars of exposure is a single order in a single book, instead of 500 orders spread across several exchanges.
What keeps them in line: fair value and index arbitrage
The future trades with a life of its own, but it can't drift far from the index. Its theoretical price, fair value, is calculated according to CME as:
Fair value = Cash × [1 + interest rate × (days to expiration / 360)] − Expected dividends
The logic is simple: buying the future saves you financing the purchase of the stocks (hence the interest is added), but you give up the dividends the stockholder would collect (hence they're subtracted).
If the ES gets more expensive than fair value, the arbitrageur sells the future and buys the basket (or SPY). If it gets cheaper, it does the opposite. By doing so, it pushes both prices back into line. Arbitrage is the mechanism that transmits pressure from one market to the other.
Two important nuances that usually get left out:
- It isn't free or completely risk-free. There are fees, financing costs, price impact and execution risk (one leg filling and the other not). That's why the future can move within a no-arbitrage band around fair value without it being worth anyone's while to step in.
- Speed matters enormously. CME's data centre is in Aurora (Illinois); stocks trade in New Jersey (NYSE in Mahwah, Nasdaq in Carteret). Microwave networks cover that distance in about 4 milliseconds, against roughly 6.5 for the best fibre (Quincy Data). That two-millisecond difference has justified investments worth millions, because whoever gets there first captures the arbitrage.
Why the ES usually moves before the cash market
A large share of S&P 500 price discovery happens in the future: it's cheaper, faster and open when the cash market is closed. That's why, when you analyse the index, the ES chart usually reflects real price action best. If you work on long series, remember how to handle futures rollover.

To analyse ES futures with their order book and real CME volume, the platform I use is NinjaTrader.
Affiliate link · paid partnership with NinjaTrader · #ad #NinjaTraderPartner
The opening and closing auctions
US stocks don't open and close with a simple switch. They open and close with auctions: periods in which orders build up and are all crossed at once, at a single price, the one that maximises traded volume. And those prices, the open and the close, are the ones funds use to value their portfolios, indices use to calculate their expirations and passive managers use to rebalance.
All times are the exchanges' official times, in Eastern Time (ET). The opening comes first and the close afterwards, in the order they happen during the session.
The opening auction
The regular session starts at 9:30 a.m. ET, but each stock's opening price is built during the preceding hours. On NYSE the process has three phases (official NYSE fact sheet):
From 6:30 a.m.: order entry
Orders for the open are accepted: Market on Open (MOO), Limit on Open (LOO), regular limit and market orders, and floor brokers' D orders. Unlike the close, on NYSE opening orders can be entered and cancelled right up until the stock opens, even if that happens after 9:30 a.m.
From 8:00 a.m.: the imbalance is published
Every second, if it has changed, NYSE publishes how many shares are already paired for the open, how many are still unmatched, and on which side. It's the same invitation mechanism as at the close: a buy imbalance attracts sellers willing to provide liquidity at the open, and vice versa.
From 9:30 a.m.: the DMM opens each stock
The designated market maker runs each stock's auction. If the opening price is within 10% of the reference price, it can open the stock algorithmically; further away, the DMM opens it manually. That's why, on days with big news, some stocks open late: the DMM waits for enough of the other side to show up.
Nasdaq has no DMM: its open is an algorithmic cross, the Opening Cross (Nasdaq). The imbalance indicator (NOII) is published from 9:25 a.m., every 10 seconds, and every second from 9:28. MOO orders are accepted until 9:28 and LOO orders until 9:29:30. At 9:30 a.m. the cross executes and sets the official opening price of each Nasdaq stock.
Why the open is more fragile than the close: it concentrates in one go everything that has happened since the previous close (earnings, macro data, the Asian and European sessions). The future has already priced in much of that information overnight, and the opening auction forces stocks to catch up in a single cross. That's why the first minutes of the US cash session carry so much volume and volatility, in the ES as well.
The closing auction
It's the single biggest concentration of volume in the day. According to BMLL data, in 2024 about 12% of S&P 500 notional volume traded in the closing auction, and on rebalancing or expiration days the figure approaches 20% (BMLL).
The schedule on NYSE (official fact sheet) and Nasdaq (Nasdaq Trader):
Until 3:50 p.m.: MOC and LOC orders can be freely entered on NYSE
Market on Close (MOC) and Limit on Close (LOC) orders can be sent, modified and cancelled. Meanwhile, the continuous market keeps trading normally.
3:50 p.m.: the imbalance is published
NYSE publishes the regulatory imbalance and from then on disseminates an informational imbalance every second: how much has been paired, how much is unpaired and in which direction. From that moment, new MOC and LOC orders are only accepted if they offset the imbalance, and they can no longer be modified or cancelled. Nasdaq also starts publishing its NOII at 3:50, every 10 seconds, and every second from 3:55.
3:55 to 4:00 p.m.: final cut-offs
Nasdaq accepts MOC orders until 3:55 and LOC orders until 3:58. On NYSE, Closing Offset orders (limit orders that only execute against the opposite side of the imbalance, never add to it and have the lowest priority) keep coming in, along with floor brokers' D orders, which according to NYSE accounted for around 60% of closing auction volume in the S&P 500 stocks listed there (September 2025; the remaining 40% was split equally between MOC and LOC).
4:00 p.m.: the cross
The continuous market stops and the system crosses all closing orders at a single price. That's each stock's official closing price, and from those the official SPX close is calculated.
Who absorbs the imbalance, and how do they hedge?
This is one of the most interesting questions, and the answer has two parts.
Who absorbs it. Exchanges don't publish names, so any list of specific firms you come across is a guess. What is documented is the mechanism: the imbalance published at 3:50 p.m. is an open invitation. It attracts offsetting orders from funds, market makers and arbitrageurs who see in it an opportunity to provide liquidity at a favourable price. NYSE has orders designed specifically for that (Closing Offset), and each stock's DMM takes part to close it out.
How they hedge. Whoever ends up buying excess stock in the closing auction can hedge in the ES after 4:00 p.m., because the future keeps trading until 5:00 p.m. ET. And if they need to lock in the exact price, CME offers a specific tool: BTIC (Basis Trade at Index Close).
What BTIC is (and what it isn't)
BTIC isn't a futures MOC order. It's a way of trading only the basis (the difference between the future and the index) during the day. At the close, CME converts that trade into a futures position at a price equal to the official SPX close plus the agreed basis (CME Group). That way, someone who traded stocks at the close can have their futures hedge at exactly the same reference price. Its equivalent for the open is called TACO (Trade at Cash Open).
The open also plays a role almost nobody connects with the future: the ES quarterly expiration settles against it.
How the ES settles and expires
- ✓Daily settlement: the volume-weighted average price (VWAP) of all trades in the lead contract between 2:59:30 and 3:00:00 p.m. Chicago time (3:59:30-4:00:00 p.m. ET), rounded to 0.25
- ✓Last trading day: the third Friday of the contract month (March, June, September and December), until 9:30 a.m. ET
- ✓Final settlement: the SPX Special Opening Quotation (SOQ), calculated from the opening price of each of the 500 stocks on its primary market that same Friday
Source: CME Group. The practical consequence is clear: on quarterly expiration Fridays, every ES position still open is cash-settled against the stocks' opening auction. That's why those opens, and the week before them with the contract rollover, have volume and behaviour that look nothing like a normal day.
The S&P 500 trading day at a glance
To have it all in one place, here's the timeline of a normal session, in Eastern Time.
| Time (ET) | What happens |
|---|---|
| Sunday 6:00 p.m. | Globex opens: the ES trading week starts with the Asian session |
| 4:00 a.m. | Pre-market trading in stocks begins |
| 6:30 a.m. | NYSE starts accepting orders for the opening auction |
| 8:00 a.m. | NYSE starts publishing the opening imbalance |
| 8:30 a.m. | Key US economic releases (payrolls, CPI, GDP, retail sales) |
| 9:25 to 9:28 a.m. | Nasdaq publishes the opening imbalance; MOO order entry closes at 9:28 |
| 9:30 a.m. | Opening auctions and start of the regular trading session in stocks |
| 10:00 a.m. | Second round of economic releases (ISM, consumer confidence, JOLTS) |
| 2:00 p.m. | Federal Reserve rate decision, on FOMC meeting days |
| 3:50 p.m. | NYSE cut-off for MOC and LOC orders and publication of the closing imbalance |
| 3:59:30 to 4:00 p.m. | ES daily settlement window (VWAP of the last 30 seconds) |
| 4:00 p.m. | Closing auctions and end of the regular trading session in stocks |
| 5:00 to 6:00 p.m. | ES daily maintenance break on Globex |
| 8:00 p.m. | End of after-hours trading in stocks |
When the other side disappears: the Flash Crash
Back to the market maker. We've seen it isn't obliged to absorb unlimited losses. What makes it pull back? Three things, usually combined:
Inventory losing value too fast
If the price falls faster than the spread can offset, every contract it buys is worth less the next instant. The logical defence is to pull its bids or move them away from the price.
Blindness: delayed or inconsistent data
A market maker calculates its fair price from related markets (cash, SPY, other futures). If that data arrives late or doesn't add up, it no longer knows what price it should quote or how to hedge reliably. In that situation, quoting means trading blind.
Internal risk limits
Every firm has automatic limits on losses, position and volatility. When they're breached, systems cut back or stop activity without anyone having to decide it in the moment.
If several liquidity providers react at once, the book thins out abruptly and price can cover in seconds a distance that would normally take hours. The most studied case is 6 May 2010.
6 May 2010, according to the official report
The joint SEC-CFTC report reconstructed what happened in great detail. This is what it says, without embellishment:
- The trigger. In an already nervous session (the European debt crisis was weighing on markets), a mutual fund complex started selling 75,000 ES contracts (about $4.1 billion) as a hedge for its portfolio. The report doesn't name it; the press identified it as Waddell & Reed. It used an algorithm programmed to sell 9% of the previous minute's volume, without regard to price or time. The last time the same firm had executed a sale of that size it took more than 5 hours; this time it took about 20 minutes.
- The "hot potato" effect. High-frequency algorithms absorbed the first sales and started passing the contracts back and forth among themselves. Between 2:45:13 and 2:45:27 p.m. ET they traded more than 27,000 contracts, 49% of volume, while their net position changed by only about 200 contracts. That huge volume made the selling algorithm, which tracked volume rather than price, speed up its sales.
- The book almost completely emptied. Buy-side depth in the ES went from about $6 billion in the morning to about $2.65 billion by 2:30 p.m., and then to just $58 million: less than 1% of the morning's level.
- The fall. The ES fell more than 5% in four and a half minutes, to a low of 1,056 points. In just 15 seconds it fell 1.7%.
- The pause. At 2:45:28 p.m. ET, CME's Stop Logic protection triggered and the ES halted for 5 seconds. When it resumed, sellers had stepped back, buyers reappeared and the price rebounded almost as violently.
What is usually told wrong about the Flash Crash
You'll often read that the ES book "went empty" and that futures sales were filled against one-cent orders. That's not what happened. The ES book thinned to less than 1%, but it didn't empty, and CME's price bands prevented absurd fills in the future. The $0.01 fills happened in stocks and ETFs: Accenture, for example, went from almost $40 to one cent. Those were placeholder quotes ("stub quotes") that some market makers left far from the price just to formally meet their obligation to be present.
The spillover into the stock market was the most serious chapter. More than 20,000 trades in more than 300 securities were broken, all executed at prices at least 60% away from their 2:40 p.m. levels. More than two thirds of the affected securities were ETFs. The Dow Jones fell close to 1,000 points (around 9%) at the worst point of the session before recovering much of the drop within minutes.
Years later, in 2015, the CFTC charged a British trader, Navinder Sarao, with manipulation through spoofing (placing large orders with no intention of executing them) which, according to the regulator, contributed to the conditions of that day (CFTC). The nuance matters: the 2010 report places the main trigger on the 75,000-contract order and the withdrawal of liquidity, not on a single person.
The underlying lesson: liquidity isn't a fixed property of the market. It's the sum of decisions by participants who can change their minds in milliseconds. What looks like an infinitely deep market on a normal day can become a vacuum when the risk of staying outweighs the benefit of being there.
Market safeguards: circuit breakers and other protections
After 2010, regulators and exchanges strengthened a system of protections that works on several levels. They don't stop market makers from pulling back; what they do is slow the price down to give liquidity time to return.
Market-wide circuit breakers
They're calculated on the cash S&P 500 index, not on the future, and against the previous day's close (NYSE Rule 7.12):
| Level | S&P 500 decline | What happens |
|---|---|---|
| Level 1 | 7% | 15-minute halt, only if triggered before 3:25 p.m. ET |
| Level 2 | 13% | 15-minute halt, only if triggered before 3:25 p.m. ET |
| Level 3 | 20% | Trading halts for the rest of the session |
Level 1 was triggered four times in March 2020 (on the 9th, 12th, 16th and 18th), during the pandemic sell-off. When a circuit breaker trips, the ES halts at the same time as the cash market and, since 2020, reopens after 10 minutes with the next level as its downside limit.
The future's own protections
- ✓Price limits outside regular hours: the ES can't trade beyond ±7% of the previous day's reference price. It's a limit, not a halt: trading continues within it
- ✓Overnight dynamic circuit breaker: if the price moves more than 3.5% within an hour, the market halts for 2 minutes
- ✓Velocity Logic: if the price travels too many ticks within one second, CME briefly pauses the market so the book can rebuild
- ✓Stop Logic: if a chain of triggered stop orders would push the price beyond certain limits, the market goes into a pause of a few seconds (the one that halted the Flash Crash)
- ✓Price bands: the system rejects limit orders too far from the last traded price
Source for the limits: CME Group, S&P 500 price limits FAQ.
Protections in stocks and options
- The ban on stub quotes. Since December 2010, under exchange and FINRA rules approved by the SEC, stock market makers must quote within a reasonable band of the best market price. That put an end to one-cent quotes (SEC).
- Limit Up-Limit Down (LULD). Since 2013, each stock has dynamic price bands (5% for S&P 500 stocks): if the price tries to move outside them, trading pauses.
- Wide Market Protection in SPX options. Since December 2025, when the spread in SPX options is abnormally wide, Cboe doesn't fill market orders in one go: it displays them at a reference price and makes them progressively more aggressive in 200-millisecond steps (Cboe). It's a protection for whoever sends the order, preventing fills at absurd prices when there's no liquidity.
What this changes for a Wyckoff trader
All of the above may look like market plumbing, far removed from a chart with a Spring or a Selling Climax. It isn't. There are four direct consequences for anyone who analyses price and volume.
Price moves on the imbalance between aggressive and passive orders
Wyckoff's law of supply and demand has an exact translation in microstructure: price advances when aggressive orders on one side exceed the passive liquidity on the other. A move with a lot of volume and little progress shows passive liquidity absorbing; a wide move on little volume shows there was no liquidity to get through. It's the basis of the law of effort vs result.
Not all volume is intent
A significant share of ES volume is hedging: options dealers adjusting delta, arbitrageurs aligning future and cash, portfolios being hedged. That volume is real, but it doesn't express a view on price. That's why seeing a high-volume bar isn't enough: you have to interpret it in its structural context.
Watch the volume of closes, opens and expirations
Volume at the close, on rebalancing days and on quarterly expiration Fridays is inflated by mechanical needs (funds valuing at the close, settlements, rollover). A volume spike on those dates isn't automatically a buying or selling climax. Before labelling an event, check the calendar.
Wide-range bars without volume can be liquidity voids
When liquidity providers pull back, price can travel a long way on little traded volume. That bar doesn't prove one side's strength; it proves the other side's absence. It's exactly what Order Flow and Volume Profile show: low-volume areas that price moves through quickly.
The idea that ties it all together
The market isn't an adversary with intentions. It's a system of participants with different needs: some provide liquidity and get paid for it, others consume it because they need to execute, others hedge and others arbitrage. Price and volume analysis works because those needs leave footprints. Understanding who leaves each footprint is what separates a naive reading from a professional one.
If you want to see how all this looks in real time, in the order book and the tape, you have the foundations in what Order Flow is and in auction market theory.
Key takeaways
- • In the ES, the trader on the other side is whoever has the resting order in the book; the legal counterparty is CME Clearing
- • Market makers earn the spread and fear informed flow; they aren't obliged to absorb unlimited losses
- • They hedge with futures, SPY, stock baskets and, in options, with continuous delta hedging
- • SPX, ES and SPY are three ways into the same index, tied together by arbitrage and fair value
- • The opening and closing auctions concentrate mechanical volume; the ES settles daily on the VWAP of the last 30 seconds and expires on the third Friday's open
- • In the 2010 Flash Crash ES liquidity fell below 1% of the morning's level; today's safeguards slow the price down; they don't force anyone to provide liquidity
Frequently asked questions
Who is the counterparty when I buy or sell a future like the ES?
Operationally, another participant with a resting limit order in CME's central order book, often a market maker. Legally, the clearing house, CME Clearing: once the trade is matched it steps in through novation and becomes the buyer to every seller and the seller to every buyer, which removes counterparty risk.
Are market makers obliged to always take the other side of my trade?
Not without limits. CME's market maker programmes require participants to quote both sides for a percentage of the session, with a maximum spread and a minimum size, in exchange for fee incentives. But none of them is obliged to absorb unlimited losses: under extreme stress they widen spreads or pull their orders, as happened on 6 May 2010.
What is the difference between SPX, ES and SPY?
SPX is the S&P 500 index, a calculation that cannot be bought directly. ES is CME's E-mini future ($50 per point), which trades almost 23 hours a day on margin. SPY is an ETF that tracks the index and trades during stock market hours. The three are tied together by arbitrage. SPX options are European-style and cash-settled; SPY options are American-style with physical delivery.
How does a market maker hedge after selling an option?
With delta hedging: it buys or sells the underlying (usually the ES future or SPY) in the amount that neutralises the option's sensitivity to price. Because that sensitivity changes as the market moves (gamma), the hedge has to be adjusted continuously, which generates order flow in the futures market.
What time is the closing auction and when is the imbalance published?
On NYSE, Market on Close and Limit on Close orders are accepted until 3:50 p.m. ET; at that point the regulatory imbalance is published, followed by an informational imbalance every second. On Nasdaq the imbalance indicator (NOII) starts at 3:50 p.m. and MOC orders are accepted until 3:55 p.m. The cross executes at 4:00 p.m. ET.
What happens if the S&P 500 falls 20% in one day?
Level 3 of the market-wide circuit breaker is triggered and stock trading halts for the rest of the session. Level 1 (7%) and Level 2 (13%) only pause trading for 15 minutes if they are hit before 3:25 p.m. ET. The ES future halts at the same time and reopens after 10 minutes with the next level as its limit.
Advanced Wyckoff Course
Read the footprints, not just the bars
Master the Wyckoff Method + Volume Profile to tell real intent from mechanical volume and read who is behind each move.
View the Advanced Wyckoff Course