Wyckoff Phases and Structures
Phase analysis helps us structure accumulation and distribution processes by providing the overall market context.

Rubén Villahermosa
Trader and educator
Article Summary
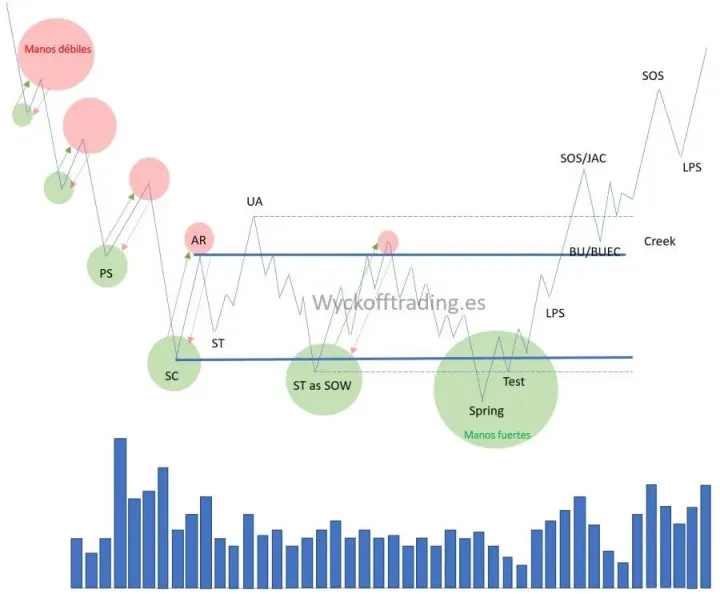
Wyckoff structures are divided into 5 phases: Phase A (stopping the previous trend with Selling/Buying Climax and Automatic Rally/Reaction), Phase B (building the cause through absorption), Phase C (test with Spring/Shakeout or UTAD), Phase D (trend within the range with Sign of Strength/Weakness and Last Point of Support/Supply), and Phase E (trend outside the range). Each phase has specific events that help identify the market context and the best trading zones.
Phase analysis helps us structure accumulation and distribution processes by providing the overall market context. Once we identify the general context, we will be in a position to expect one thing to happen instead of another.
The Importance of Context
Context is a very important characteristic of the Wyckoff methodology, giving it a significant advantage over other technical analysis approaches. For example, a trader based on traditional technical analysis may see a resistance and look to go short on that area expecting a bearish market reversal; while a Wyckoff trader who has correctly identified the phases and analyzed the price dynamics within the range, may have established a higher probability that price will effectively break that resistance to the upside and could even consider buying expecting the start of the bullish trend outside the range.
The five phases: from A to E
Within the Wyckoff methodology we have five phases: from A to E, and each one has a unique function:
Phase A. Stopping the previous trend.
Phase B. Building the cause.
Phase C. Test.
Phase D. Trend within the range.
Phase E. Trend outside the range.
Through price and volume analysis we can correctly identify when each phase begins and ends. It is very important that the analysis up to the current moment is correct since it will be the only way to take advantage of the message underlying its development.
The phases are based on the fact that all campaigns (accumulations and distributions) require a certain amount of time until completion. During this time, price develops the structures we already know. The power of phase analysis lies in the fact that these structures generally follow repetitive patterns in their development. This means that, if we are able to correctly identify what is happening (accumulating or distributing), we will be closer to planning scenarios with a higher probability of success.
Video in Spanish with English subtitles available

Phase A: Stopping the Previous Trend
The main function of this phase is to stop the previous trend movement and return the market to a state of equilibrium between supply and demand forces, or between buyers and sellers. We move from a trending context to a range context.
Phase A is composed of the first four events:
Preliminary Support or Preliminary Supply
Selling Climax or Buying Climax
Automatic Rally or Automatic Reaction
Secondary Test
Prior to the start of this first phase, the market is controlled by one of the two sides. As we know, seller control will be represented as a bearish trend, and buyer control as a bullish trend.
Price may be reaching interesting levels where large participants begin to see value. That is, they see a potential profit with the difference they have found between the price they assign based on their valuations and the current price. It is time to begin developing the absorption campaign.
But we cannot identify this signal of true interest until the first events of the methodology appear. The Preliminary Stop with its volume spike already alerts us to increased participation and possible massive position closing. Most likely, large traders have begun to glimpse an overextended condition in price and are starting to take profits.
The Climax, which as we know can also appear without climactic volume (Selling Exhaustion and Buying Exhaustion), identifies one of the structure's extremes and its action is very relevant to finish exhausting whoever until then maintained market control.
The appearance of the Reaction is one of the events that transmits the most information since it confirms that something is happening. Price was previously in a prolonged trend and this reaction is the first time it shows with relative significance that interest is beginning to appear on the other side.
With the Test, this first phase ends, giving way from there to the development of Phase B.
Position Management vs New Trades
Phase A will mainly be useful for position management; that is, when we are in the market with an open position. The complete development of this Phase A will tell us that it is a good time to close that position. But Phase A will not be operationally useful for seeking new trades, since at any stage of its development, uncertainty is total about whether it really is a new range or not.
This is the main problem with identifying Phase A, that until that moment when the Secondary Test develops, we cannot know if a change of character has really occurred and the market will move sideways from there, or if it is simply a brief consolidation to continue in the trend direction.
To try to solve this problem we must observe these first four events with critical judgment, but above all:
We should identify some type of climactic volume, whether in the preliminary stop or the climax. This is the only representation of professional activity.
The reaction event is key. The only way we have to discard the possibility that it is a simple consolidation is that the reaction is a movement that powerfully catches attention, that it is of a size not seen previously during the course of that trend.
We must wait for Phase B to develop. This sideways movement will be the definitive signal that will confirm the change in market state.
Phase B: Building the Cause
After the Secondary Test, Phase B begins, whose intention is the construction of the cause with the objective of preparing the subsequent effect.
Phase B is composed of successive tests (Secondary Test in B) that can occur at both the upper and lower extremes of the structure:
Upthrust Action or Upthrust
Secondary Test as Sign of Weakness or minor Sign Of Weakness
During this phase the market is in equilibrium and it is here where the large professionals take advantage to absorb most of the liquidity they require before ending the campaign.
Temporal Proportionality
In proportional terms we want this phase to be longer than Phases A and C. This is a general guideline since, although there will be occasions when the phases will be of equal or even shorter duration (like rapid schemes), most likely we will find that this type of temporal proportionality is met.
In case this proportionality is not met; that is, Phase B has a shorter duration than Phase A or C, it will denote urgency on the part of the traders and adds greater strength to the trend movement that follows.
As we introduced in the last point of Phase A, the development of this Phase B will be the definitive footprint that will confirm the change of character. Once we see some sideways movement after the stop, the main reading we should make is that we are already without any doubt facing an analyzable structure under the principles of the Wyckoff methodology.
When we are scanning the market in search of opportunities, this context is what we should be looking for: that the asset is already in the middle of this sideways movement. At that point the market will have already developed Phase A somehow and the objective is that we are building the cause of the subsequent movement. This is where we want to be.
And this is another advantage of Phase B, the proportionality of phases. Being aware of waiting for this temporal proportionality to be met is vitally important since it will put us in a position to expect, from that moment on, that the final shakeout may occur that will definitively unbalance the market in one direction or another.

The Wyckoff Methodology in Depth
The best-selling book on the Wyckoff Method in Spanish. 325 pages that will teach you to identify institutional money footprints and trade alongside smart money.
Phase C: Test
Phase C begins with the start of the shakeout movement and ends after testing it.
In this phase, smart money, the large well-informed professionals, test the level of interest that other market participants have at certain price levels.
It is composed of the Shakeout event:
Bearish shakeout in accumulation
UpThrust After Distribution
Before initiating the trend movement, they will most likely develop this shakeout action with the objective of verifying that practically no traders are willing to enter in the opposite direction and therefore the path of least resistance is in their favor.
If they observe high participation in that zone, it will mean that there is still interest on the opposite side, they have not absorbed all available liquidity, and therefore market control is still not unbalanced toward one of the sides. Under this circumstance, two things can happen:
1. Failed Campaign
Large traders give up on the campaign. They do not have a great commitment to rotate the market and change direction. This will cause price to continue in the same direction as the preceding trend, which would leave a re-accumulative or redistributive scheme.
2. Phase B Extension
Phase B continues to extend until complete absorption occurs. The agents' valuations will be clearly outside that equilibrium zone and they will do everything possible to exhaust the participants who are interested in trading in the opposite direction.
Minor Shakeout
A very important aspect to consider is that the shakeout event will not necessarily sweep the structure's extremes. Doing so is ideal since the larger this movement, the more liquidity it will have been able to capture. But it can also happen that a shakeout is carried out without reaching the extremes, acting according to LPS/LPSY.
In any case, labels are not really important. We must think above all in functional terms and what we really care about is knowing what is really happening. It is of little use to know how the methodology labels market actions if we do not deeply understand what underlies each one of them.
Phase D: Trend Within the Range
The start of this phase is after the completion of the shakeout test and until the confirmation event develops completely.
Phase D is composed of the Breakout and Confirmation events:
Sign of Strength / Jump Across the Creek
Sign of Weakness
Last Point of Support / Back Up to the Edge of the Creek
Last Point of Supply
With no opposition in sight, the path of least resistance is clear. The market is in disequilibrium and this is observed on the chart through the development of the breakout event.
If we are correct in our analysis, after the key shakeout event, price should now develop a clear trend movement within the range with wide candles and increasing volume to cause the effective breakout of the structure.
The structure's extremes are the last barrier to overcome to conclude that one side has definitive control. If price reaches that zone, interacts with the liquidity located there pending execution and encounters too high an opposition, it leaves us with three possible scenarios:
1. LPS/LPSY Within the Range
Price may retreat again developing a Last Point of Support/Supply within the range before attacking that zone again.
2. Aggressive Absorption
Large traders decide to pay the price it will cost them to cross that zone and initiate the breakout movement from there, absorbing all those orders at a worse price. This would be evidenced by a significant increase in volume.
3. New Shakeout
The breakout attempt fails and a new shakeout develops instead, a new Test in Phase C that would cause the effective breakout toward the opposite side.
We must keep in mind that the market is a struggle between large professionals, between funds and institutions with all kinds of interests. An important point to note is that not all institutions that trade in financial markets make money. These losing institutions are the favorite victims of large traders since they handle significant amounts of capital and serve as succulent liquidity providers for well-informed traders.
If the breakout develops with relative ease and the signals left by price and volume indicate so, we will then look for the confirmation event to develop. For this, it is essential that price holds on the other side of the structure and no immediate re-entry is generated. Additionally, we will look for this test movement to be generated with little interest.
Phase E: Trend Outside the Range
This phase begins after the confirmation event.
If the test after the breakout was successful and no traders appeared in the opposite direction, it can be definitively confirmed that one side has absolute control of the market and therefore we should only look to trade in that direction.
This Phase is composed of a succession of impulse and corrective movements:
Sign of Strength or Sign of Weakness
Last Point of Support or Last Point of Supply
Price abandons the structure on which it was previously building the cause and begins a trend as an effect of it. This fact of successful breakout and confirmation is the great warning that the large professionals are positioned in that direction.
As the trend progresses, we must implement all the tools to evaluate its strength or weakness: type of trend, speed, depth, and projection of movements.
Trend Evaluation
Correctly analyzing these footprints will put us in a position to know when is a good time to look for an entry in favor of the trend (footprints that denote strength) and when it is better to stay out of the market (footprints that show weakness in the movement) to avoid entering on the wrong side and even consider the possibility of looking for counter-trend trades (footprints that denote trend reversal).
The identification of this Phase E is important because it will put us in context of looking only for trend-following trades.



Frequently Asked Questions about Wyckoff Phases and Structures
What are the 5 Wyckoff phases and their typical durations?
What specific events characterize Wyckoff Phase A?
What happens during Wyckoff Phase B and how to identify it?
Why is Wyckoff Phase C critical for trading and how to take advantage of it?
What Wyckoff Phase D events confirm a valid breakout?
How to identify Change of Character (ChoCh) in Wyckoff structures?
Master the Wyckoff Method
Comprehensive training in the Wyckoff Method with Volume Profile and Order Flow. Over 60 hours of content with real examples and access to a trading community.
