Reaccumulation Ranges
The reaccumulation process is structurally identical to the accumulation process. The only difference between them is how the structure begins to develop.

Rubén Villahermosa
Trader and educator
Article Summary
Reaccumulation is a pause within a bullish trend where large operators re-accumulate stock before continuing the movement. It is identical to accumulation, but begins after an upward movement instead of a downward one (Buying Climax + Automatic Reaction). Signs of reaccumulation include: previous bullish context, high volume on rallies, the structure acts as consolidation. The difference from distribution is subtle and is confirmed with the test event (Spring vs UTAD) and the direction of the final breakout.
Video in Spanish with English subtitles available

Reaccumulation in Trading
The reaccumulation process is structurally identical to the accumulation process. The only difference between them is how the structure begins to develop. While the accumulation range begins by stopping a bearish movement, the reaccumulation range begins after stopping a bullish movement.
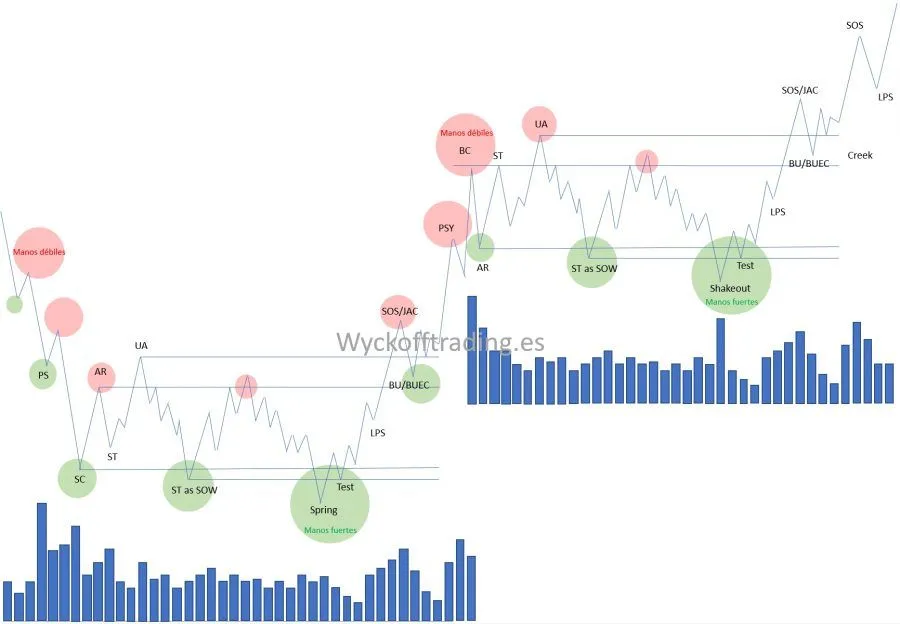
Accumulation structure followed by reaccumulation ranges
Stock Absorption
A reaccumulation is the result of a previous bullish trend that needs to be consolidated. The hands that control the asset will change during the course of the trend.
At the start of a bullish trend, the asset is under the control of very strong owners (Professional operators, strong hands); but as it develops, the stock will gradually shift toward less informed operators, weak hands.
At this point, demand is said to be of poor quality and the market needs to restart a stock absorption process where large operators regain control once again.
Structure Duration
A key point to keep in mind is that the duration of this structure will be influenced by the percentage of strong and weak hands that have control of the asset.
- If at the start of reaccumulation the asset is still primarily in strong hands, the structure duration will be shorter.
- If on the contrary weak hands control most of the stock, a longer period of time will be necessary to develop the buying process again.
The objectives of the main accumulation will not yet be fulfilled and this structure develops to add new demand to the market to continue the upward movement toward those objectives.
Reaccumulation or Distribution
A judicious analysis of price action and volume is very important to avoid confusing a reaccumulation range with a distribution range.
Both begin in the same way, after stopping an upward movement. It is necessary to internalize the characteristics of accumulation ranges, as this is one of the most compromising situations any Wyckoff operator faces.

Wyckoff Methodology in Depth
The best-selling book on the Wyckoff Method. 325 pages that will teach you to identify institutional money footprints and trade alongside smart money.
A Classic View on Reaccumulation Processes
In the course of every major bullish trend there are extended pauses. The larger the trend, the more pauses there will be. In terms of duration, they can last as little as a few months or as long as a year or more.
They are designed to torture weak hands with prolonged periods of boredom. As with all aspects of the price cycle, Wyckoff operators have discovered the principles that govern range dynamics (extended pauses).
Once a trend emerges from an accumulation, it begins to mature and changes internally. At the beginning of the trend, the strong hands (The Composite Operator) of the asset are the dominant owners and almost immediately short-term traders jump aboard the bullish trend.
These types of traders will not hold the asset during the trend's development; they will repeatedly take profits and abandon it at the first signs of trouble.
The Composite Operator intends to stay in the trend throughout its complete development; they expect the trend to have pauses during its development and will use those reaccumulation phases to add to their positions. Wyckoff operators also use those reaccumulation phases to initiate or add positions.
As the trend continues to mature, activity becomes dominated by trading rather than investing.

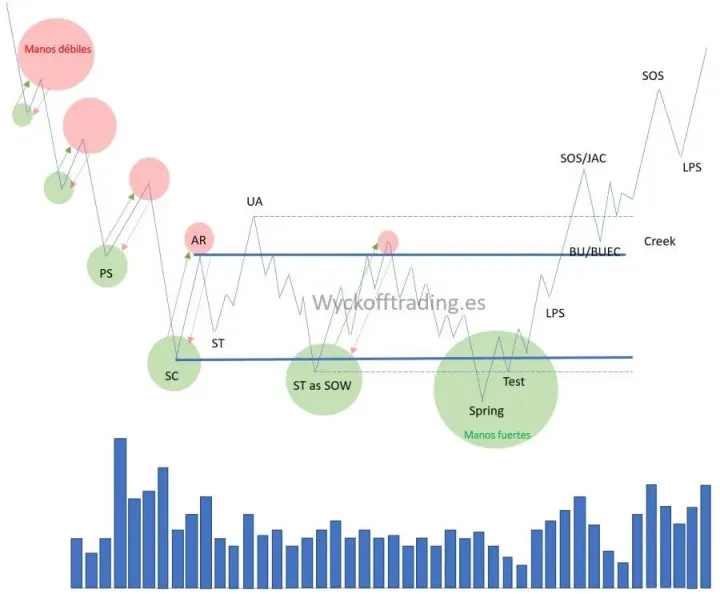
Reaccumulation process during a bullish trend
Stopping the Upward Movement
For a period of time, an acceleration can be very profitable. Price accelerations occur with expansion in ranges and high volume. Upward and downward volatility is a signal of the final stages of a trend and an exhaustion condition.
A common condition at the end of an upward movement is excess above a trend channel. This false breakout is a classic exhaustion signal and sometimes coincides with a Buying Climax which is a price stopping action. The bullish trend is so overheated with speculation that such an impulsive movement ends the advance.
Two Possible Scenarios
The Buying Climax is the beginning of one of two conditions: Distribution or Reaccumulation.
This is significant because one condition concludes with a continuation of the bullish trend (reaccumulation); while the other is the termination of the bullish trend and the first step in forming a top, referred to as distribution.
Wyckoff can help us make all the important distinctions between these two scenarios.
The reaccumulation and distribution condition begins with the same action and in the same way. It is a stopping action of the previous trend. What follows is a large range.
After the Buying Climax (BCLX), it is followed by the Automatic Reaction (AR) which is a large and volatile bearish movement that is the largest of all corrections seen within the preceding bullish trend. This is a confirmation of the BCLX if we weren't sure before.
We label the BCLX and AR and immediately draw a resistance line at the BCLX peak and a support line at the AR low. If it sounds familiar it's because the same technique applies that establishes the range limits of accumulation after the Selling Climax and Automatic Rally.
We expect price to be contained within that support and resistance during the coming weeks and months. During that time, the Wyckoff operator will study the footprints of price and volume to define whether reaccumulation or distribution is occurring.
Initially we look for a series of Secondary Tests of the BCLX area (resistance) and AR (support). Price activity will be abrupt and volatile with large upward movements toward highs and bearish movements toward the base of the range. The weak hands of the asset are being shaken out by this extreme volatility.
Signs of Reaccumulation Ranges
The AR will scare short-term momentum traders with some perverse losses. All this will happen very quickly. But from then on, the careful observer will see that volatility is decreasing. Gradually, bearish movements toward support will take longer to complete and volume will generally become lower and lower.
As the range develops, trader pessimism increases. Momentum traders have left and speculators are fishing in different waters. Sometimes the catalyst for the pause is bearish news or a disappointing report that alarms traders.
The Composite Operator is using these events to start accumulating. As with initial accumulation, the CO systematically absorbs shares as price moves toward support and ceases buying activity as price rises toward resistance.
It becomes difficult for price to return to support and this will be reflected on the chart with a narrowing of ranges and decrease in volume. The absorption principles are the same here as when initial accumulation occurred.
Difference Between Reaccumulation and Distribution
A common mistake traders make with reaccumulation is concluding that it's distribution and initiating a short selling campaign.
The key points here are:
Distribution
Volatility and volume increase as the range matures and prepares for the bearish trend.
Reaccumulation
The opposite happens: volatility and volume decrease due to absorption principles.
Reaccumulations take different forms. Absorption occurs as the range progresses. With the Creek we observe decrease in volatility and volume, an indication that reaccumulation is almost concluded.
Once absorption is complete, the jump action will take price out of the range and into a new bullish phase. This is where Wyckoff operators are busy adding shares to their portfolio.
Summary of Reaccumulation Ranges
Reaccumulation formations are the most useful and powerful patterns a Wyckoff operator can master. The Wyckoff operator emphasizes the principles behind price action. Since we focus on principles, we can see the footprints of the Composite Operator and the motives behind their activity.
Many different price structures can develop and the Wyckoff operator can equally identify the CO's activities and intentions.
Accumulation, reaccumulation, distribution and redistribution have attributes that reveal the motives and objectives of the large and informed Composite Operator. We must be skilled in the language of the tape (chart reading) to know when, where and how to get aboard with the C.O.
After the development of a BCLX and an AR, at this point there are two main scenarios that have begun: distribution or reaccumulation. The BCLX and AR become the initial support and resistance to contain the range.
It is common in reaccumulation ranges for price to spend most of the time in the lower half of the range. When this happens, traders take a very bearish perspective on the asset as they see it cannot approach resistance level. The CO is very aware of average trader tendencies and takes advantage to buy as much as possible.
When high volume is observed in the support area, we can conclude that demand is entering from the CO; but it also indicates that supply is available to be absorbed and therefore prices are likely to return to those levels until the CO finds it difficult to continue buying.
Subsequent attempts to return to support should be with decreasing volume, indicating that sellers are exhausting and have liquidated their positions; and therefore absorption by the CO is almost complete.
A strong upward movement after a Spring shows us a great change of character. This is a bullish development. It puts us on alert to enter the market on the next decline.
Volume Keys
- In reaccumulation formations volume will generally decrease in the last half of the range development.
- In distribution formations volume will generally remain high throughout the range development.
- The lack of volume on the last bearish pushes (LPS) is a good sign that absorption is almost complete.
When the trend resumes (JAC), volume will expand on bullish impulses and contract during pullbacks and bearish pauses (LPS/BUEC).
A decrease in volume on the AR is a first clue that reaccumulation is beginning.
Reaccumulations occur in markets all the time. Bullish trends have multiple pauses along the way, all of which offer opportunities to enter the market and join a larger trend.


Frequently Asked Questions about Reaccumulation
What is reaccumulation in the Wyckoff Method?
How to distinguish reaccumulation from distribution?
What events mark the start of a reaccumulation structure?
Why does reaccumulation occur according to Wyckoff?
What are the signs that a range is reaccumulative?
When is a reaccumulation definitively confirmed?
Advanced Wyckoff + Volume Profile Course
Master the complete Wyckoff methodology combined with Volume Profile. Learn to identify institutional footprints and trade with professional precision.
