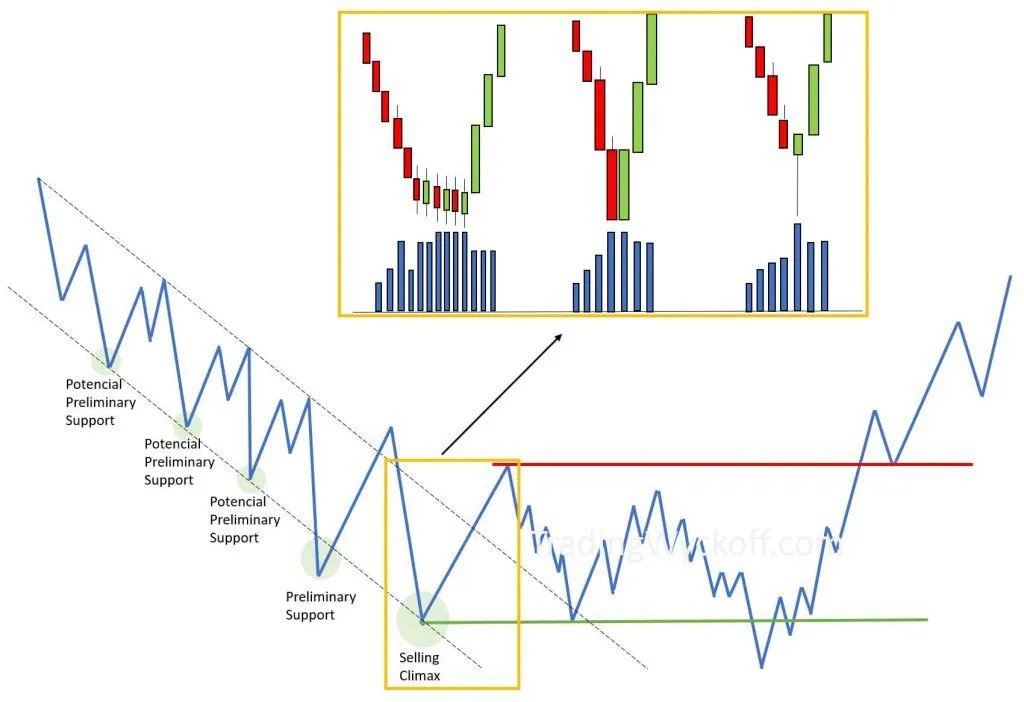
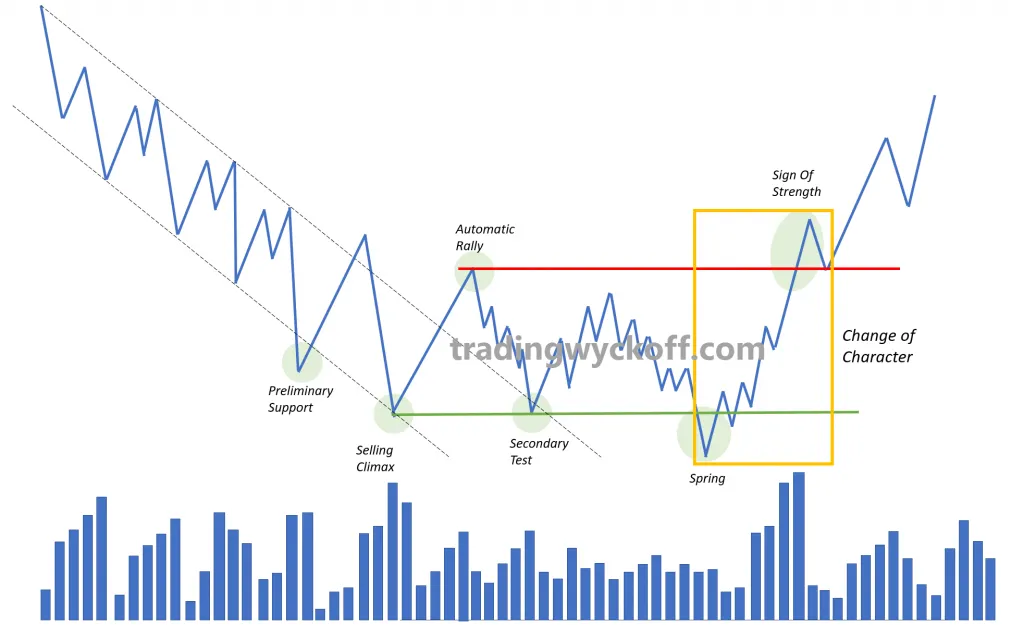
Secondary Test
The key market test action that confirms the change of character and marks the transition from Phase A to Phase B.

Ruben Villahermosa
Trader and educator
In this article
Article Summary
The Secondary Test (ST) is the fourth accumulation event that marks the end of Phase A and the beginning of Phase B. It confirms the change of character by verifying that aggressive sellers have abandoned the market. It is characterized by narrower ranges and lower volume than the Selling Climax. It can occur above or below the SC low. In Phase B, tests appear at both ends of the range (UA/UT above, ST as SOW below). Generic tests (No Demand/No Supply) evaluate operator commitment in any area of previous volume.
The Secondary Test is the fourth event within the accumulative schemes of the Wyckoff methodology. It establishes the end of Phase A, the stopping of the previous trend, and gives rise to the beginning of Phase B, the building of the cause.
Functions of the Secondary Test
As with each event, one of the important points of its identification lies in that it identifies the market context for us; it gives us an indication of what to expect from now on. In this case, we move from a bearish trend context to migrate toward a price lateralization context.
This is very interesting because, as we know, price behavior during Phase B will be a continuous fluctuation up and down between the limits of the structure.
With this context in mind, the type of trading we can develop here is to wait for price at those extremes and look for a turn to the opposite side. Either directly from the timeframe we are working on with some candlestick configuration; or by dropping to a lower timeframe to look for a minor turning structure there (if we are in the upper zone, we will look for a minor distribution structure; and if we are in the lower zone, we will look for a minor accumulation structure).
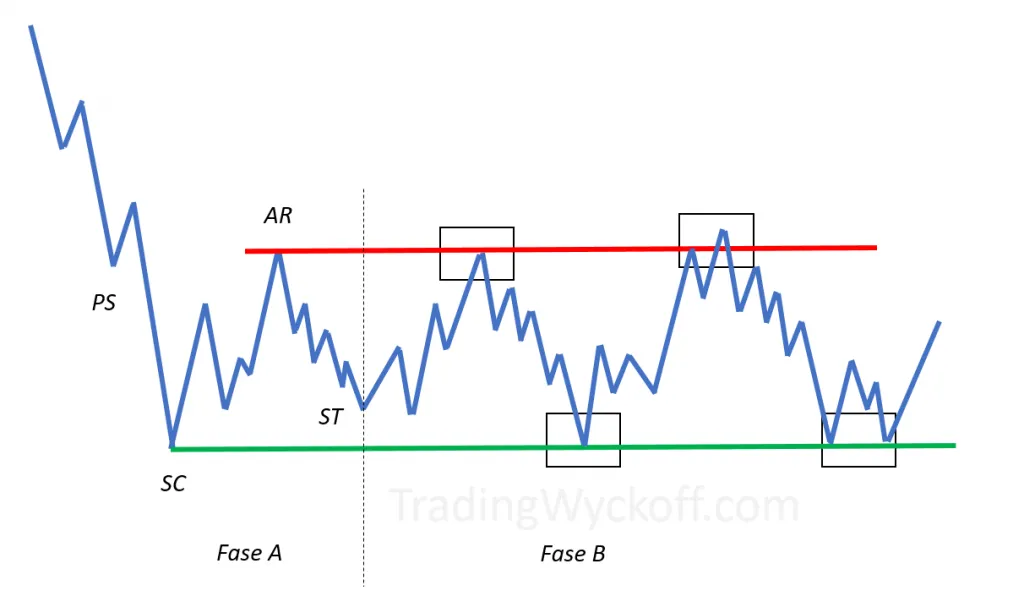
Functions of the Secondary Test in the Wyckoff structure
In functional terms, what the appearance of the Secondary Test suggests is the confirmation of the abandonment by aggressive sellers who have been pushing the price ever lower during the development of the bearish trend; to evolve toward an equilibrium environment where buyers and sellers are comfortable negotiating (building the cause for the subsequent effect).
Characteristics of the Secondary Test
For the Secondary Test to be successful, the bearish movement must be made with a narrowing in price ranges and lower volume than seen in the Selling Climax.
Although some authors defend the position that it is necessary for the Secondary Test to remain above the low established by the Selling Climax, the truth is that it is a good time to remember that the market is not a rigid entity, but is in constant change by its very nature and therefore it would be convenient to grant some flexibility to price movements.
With this in mind, we can attribute that a Secondary Test above the Selling Climax low would be seen with a neutral connotation when identifying which side (buyers and sellers) has more control of the market.
Then, it would be a good way to identify some imbalance by buyers if the Secondary Test we see is performed on the upper half of the range; and equally would identify some imbalance in favor of sellers if the Secondary Test ends slightly below the Selling Climax.
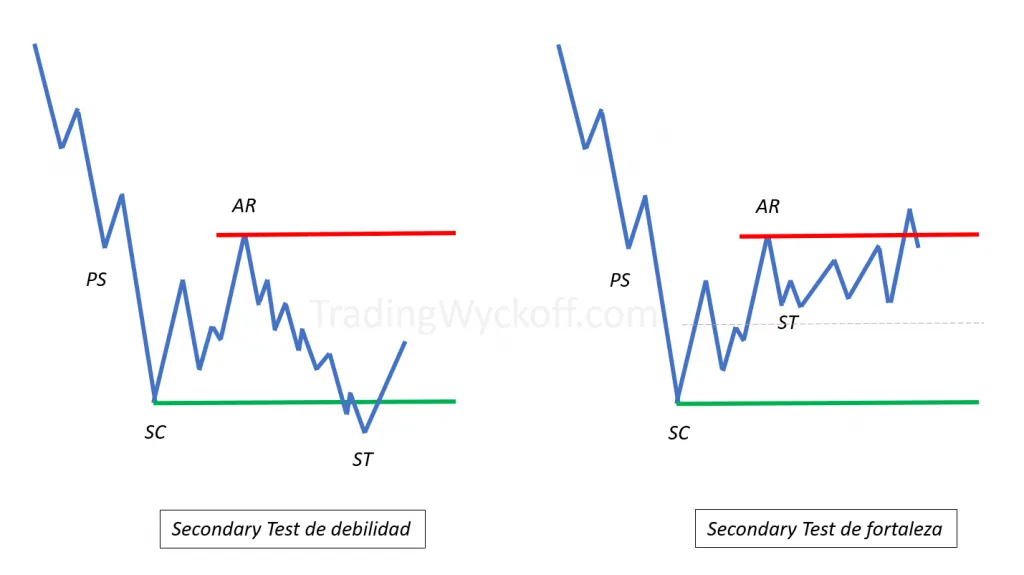
Characteristics of the Secondary Test: narrow ranges and decreasing volume
The Most Important Thing
What we really need to focus on is, in order of importance: the decrease in volume and the narrowing of ranges. As we know, volume reflects activity and therefore, low activity after a climactic event denotes lack of interest toward that side.
Secondary Tests in Phase B
Although the "official" Secondary Test is the one that appears in Phase A, it is a type of behavior that we will continue to observe in different phases of the structure's development.
Once Phase B has started, we will be watching for any type of test to develop on either of the two ends of the range.
This type of test serves to evaluate the strength and weakness of buyers and sellers. Sometimes tests will even occur at both the upper and lower end of the structure.
Depending on the subsequent effect of the range (whether it is accumulation or distribution), the labels for the same actions are differentiated. Logically, until the price leaves the range we cannot know what the real intention was behind the cause being built and therefore, in real time any labeling should be valid.
Functional Vision
Beyond seeing the market conventionally, let's also think in terms of functionality and differentiate price behaviors from two points of view: as a concept (action) and as an event (depending on location).
Secondary Test on the Upper End
The price crosses the previous high created in the stopping action but does not move too far before re-entering within the range, leaving a slight shakeout.
Initially it is a movement that denotes underlying strength since the price has been able to penetrate the resistance zone of the range; and this could not happen without aggressive buyers being present.
A subsequent evaluation will confirm whether it is really a strength test in which stock has been absorbed (bought, accumulated) with the intention of going up; or whether it is an action on which it has been distributed (sold) with the objective of taking the price lower.
This new high can be used to establish a new upper end on which to look for the effective bullish breakout (in Phase D) or the bearish shakeout of the structure (in Phase C).
When the range is accumulation/reaccumulation, this event will be labeled as Upthrust Action (UA); while if it is a distribution or redistribution structure we will label it as Upthrust (UT).
This is the only difference between these labels; if we believe with the evidence we have so far that the probability is that it is an accumulative range we will label it as Upthrust Action; and if we believe there is more probability that it is distributing we will label it as Upthrust.
minor Sign Of Strength (mSOS)
When the UA occurs and the price stays above resistance for some time before falling, this behavior can be labeled as minor Sign Of Strength (mSOS). It would be a type of test that denotes greater strength.
Secondary Test on the Lower End
It is a test to the lows of the structure that produces a lower low. It is due to either the aggressiveness of sellers or a lack of interest from buyers; which suggests that new tests to that area are likely in the future.
This type of test denotes a lot of underlying weakness. Well-informed operators know that the price is overvalued and are in a hurry to sell. Hence that extreme weakness.
From this new low we can draw another support level on which to expect the effective bearish breakout or the final shakeout before the upward trend movement.
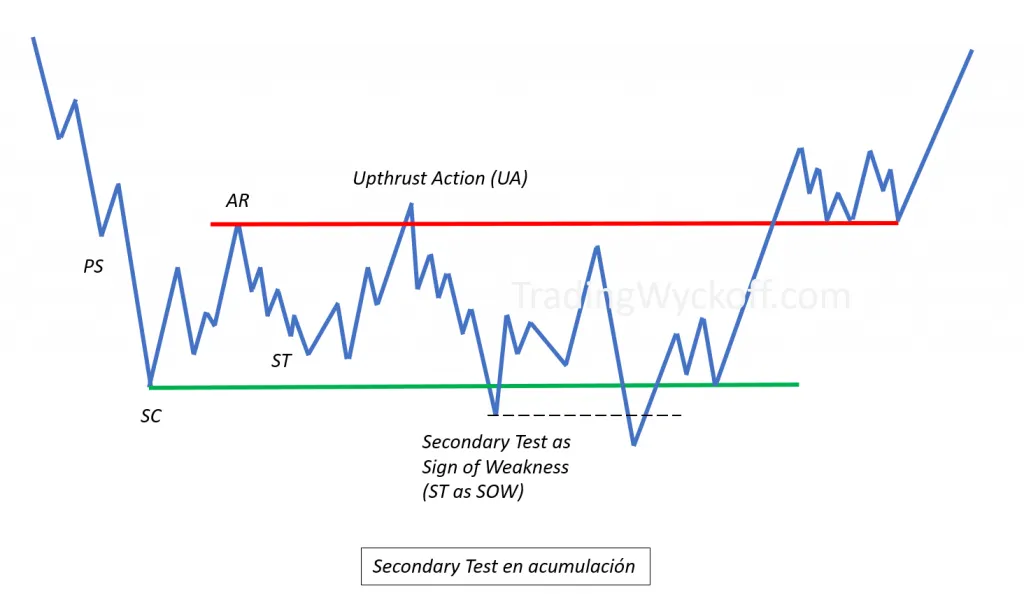
Secondary Test as Sign of Weakness (ST as SOW) in accumulation structure
If we are facing an accumulation structure, we will label this event as Secondary Test as Sign of Weakness (ST as SOW). Generally there are more chances of this event appearing when the Secondary Test of Phase A has produced a lower low. There is extreme weakness in the market and that zone will need to be tested in the future.
When the range is distribution or redistribution we label this event as minor Sign Of Weakness (mSOW).
An indication that we may be facing a mSOW is if the Secondary Test of Phase A is a poor bullish movement, with very little travel (lack of buyer interest).
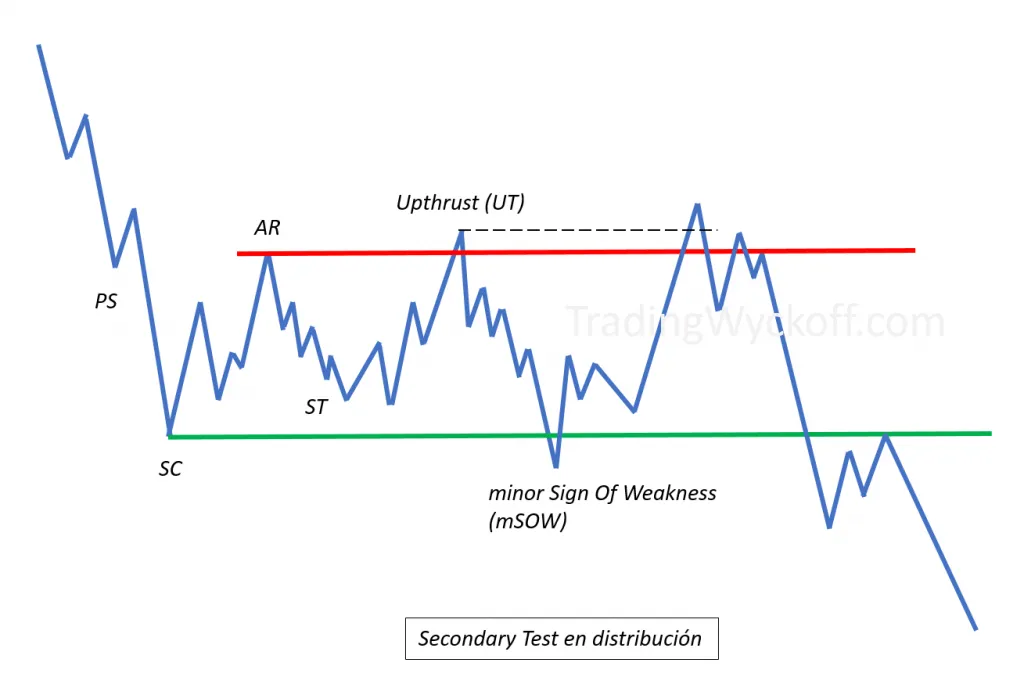
minor Sign Of Weakness (mSOW) in distribution structure
Labeling Simplification
As we say, we can only know which label is correct once the range has been confirmed in one direction or the other. Therefore, to not complicate it more than necessary, a simple solution could be to label such events as Secondary Test in Phase B (ST in B), a label you will also find in some methodology analyses.
The Generic Test
A test, by definition, is an attempt, evaluation, or examination of something. In the case of Volume Spread Analysis (VSA), it is a test to confirm who has control of the market.
If professional operators have interests higher up, they will want to make sure that supply has been eliminated or absorbed before starting the upward movement. Conversely, if they foresee lower prices, they will do their best to confirm that there are no buyers willing to complicate their downward movement.
As the market enters an area where there was previously high volume, two things can happen:
Low volume = Valid Test
Clearly indicates lack of interest and suggests that the market is now prepared for a trend movement in favor of the least resistance.
High volume = Invalid Test
Would indicate that there are still operators willing to continue pushing the price. The optimal here would be to wait for repeated tests to appear until confirming that there is no stock available; or for the market to continue in favor of its last movement.
Due to the above, tests can be a great time to enter the market, since if the test is valid, we will be "betting" in favor of the force that pushes the most and that in theory has greater control of the market.
Where to Look for Tests
Due to its generic nature, it is an action that can be useful for making trading and investment decisions in different market contexts, the most recommended being:
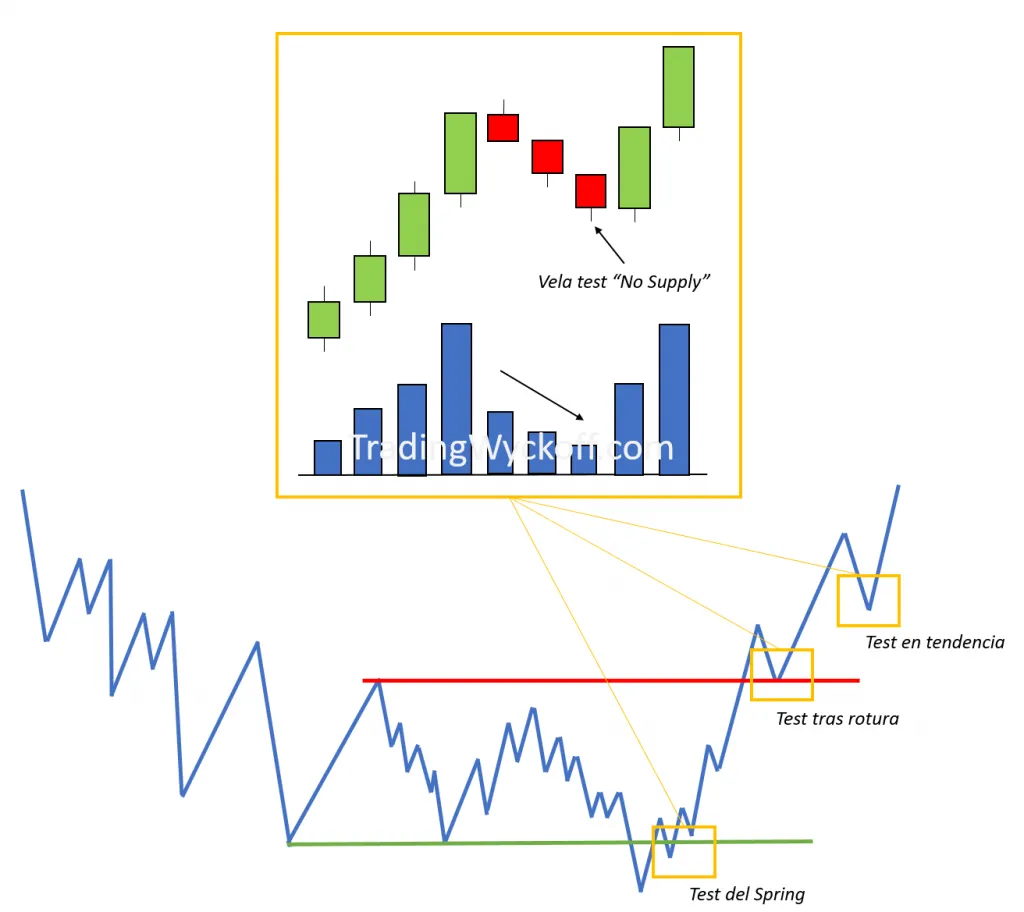
Example of No Demand - bearish test with low volume
Video in Spanish with English subtitles available

Test After Shakeout
Known as test of the Spring (bearish shakeout) or test of the Upthrust (bullish shakeout), it develops during Phase C, the test phase, prior to the structure breakout.
It is the market moment where we can have the best risk/reward ratio; since if the test is genuine, we will be very close to the extreme of the structure (where the Stop Loss order should be placed) and the journey to the Creek could be quite wide (to take as first Take Profit or management).
Test After Breakout
It develops during Phase D, where the price has started the trend movement within the range and it is a critical moment since what is being evaluated is whether the Creek breakout will be valid or if it will be a shakeout.
The risk/reward ratio is not as generous as what we can have in the test after shakeout, but even so we may be facing a great opportunity since if we are correct in the analysis, the price will develop the effect of all the cause that has been built during the development of the range.
Test in Trend
We must observe that the price is in Phase E of the structure where the market begins to move trendingly outside the range.
If the trend is very fast, sometimes it will take time to stop at least temporarily to develop a new scheme in favor of that trend. For such cases of speed, we can look for this action to develop, which will give us an opportunity to join the movement.
Caution in Phase E
If the technical targets of the structure have already been covered, I would particularly quarantine the entry. In case of Stop Loss, I would wait for the development of a shakeout + test outside the range to place the order at its extreme. For Take Profit, the most advisable thing is to continue looking for liquidity zones since we know it is very likely that the price will go in search of them.
How the Test Appears on the Chart
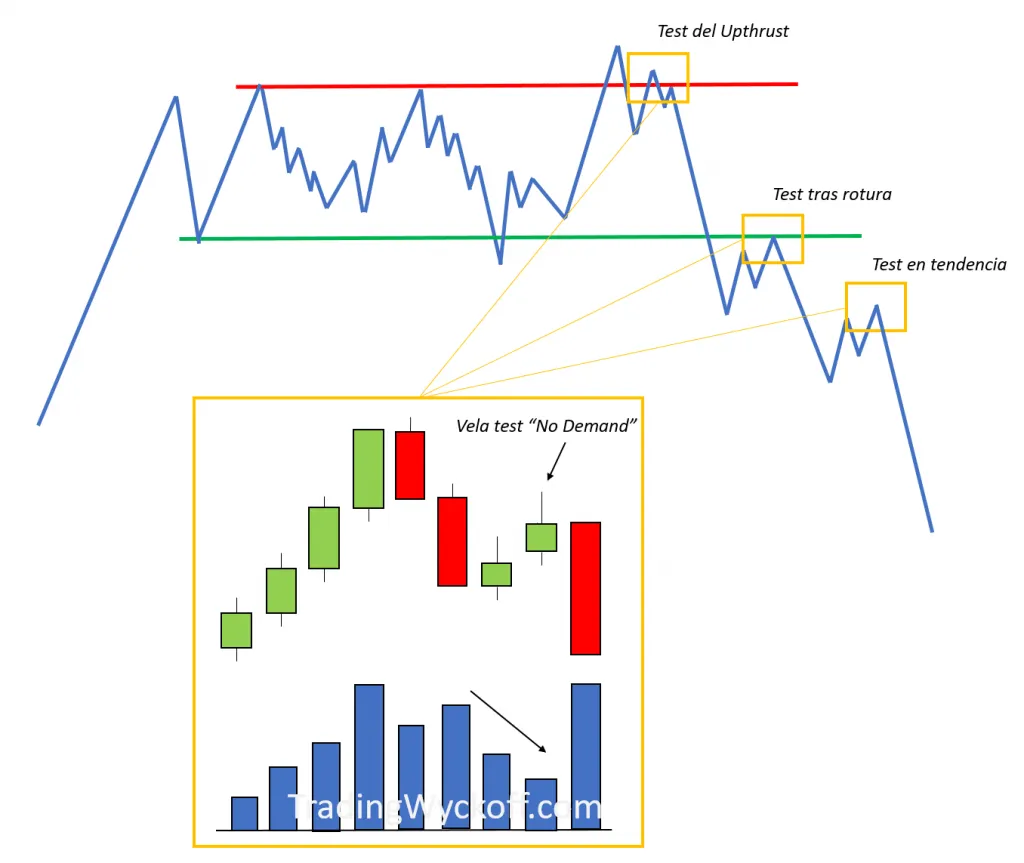
Example of No Supply - bullish test with low volume
In Volume Spread Analysis this type of candles are known as No Demand (bullish candle) and No Supply (bearish candle).
The test is considered valid when the candle has a volume lower than that of the two previous candles, denoting as we say that lack of interest toward that direction.
When we are in an environment of possible underlying strength (such as a Spring, a bullish Creek breakout or a bullish trend) we will look for the test, in addition to showing lower volume than the two previous candles, to occur on a bearish candle (No Supply). The smaller the range of said candle, the better.
On the contrary, when our analyses tell us that we may be in an environment of market weakness (such as an Upthrust, a bearish Creek breakout or in the middle of a bearish trend), we will look for the test to occur on a narrow range bullish candle (No Demand).
Difference Between Secondary Test and Generic Test
Conceptually it is the same action: a movement that develops to evaluate the commitment of operators in one direction and that necessarily must appear with a decrease in price ranges and volume to take it as valid.
Key Difference
The only difference lies in that the Secondary Test is a specific event of the Wyckoff methodology, with the structural connotations already discussed; and the generic test is a global event, well known in the VSA (Volume Spread Analysis) methodology that focuses primarily on the action itself and on what its result suggests to us.

Wyckoff Methodology in Depth
This article is an excerpt from the book. If you want to master test analysis and understand when and where to enter with greater probability, the book provides all the necessary knowledge with supporting charts.
View book