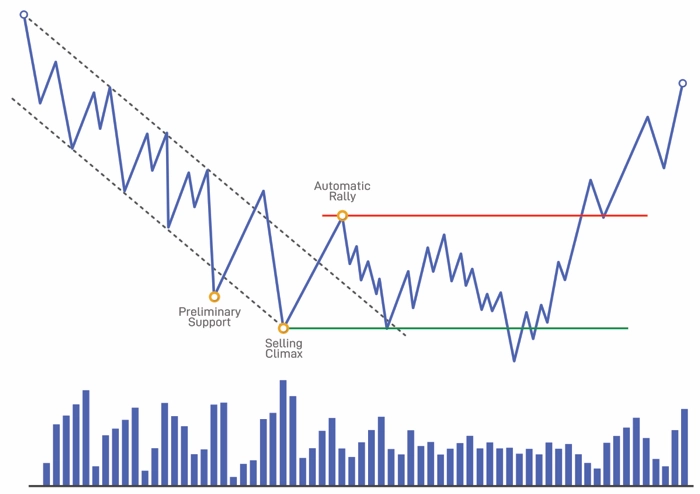
Selling Climax
The panic selling event where institutional capital begins accumulating at attractive prices, marking the start of the accumulation structure.

Ruben Villahermosa
Trader and educator
Article Summary
The Selling Climax (SC) is a very powerful signal of strength that emerges after a prolonged bearish movement. It represents the moment of maximum panic where institutional capital begins accumulating at attractive prices. Its low establishes the support of the structure. It can appear as a bearish bar with climactic volume or through exhaustion (Selling Exhaustion) with decreasing volume. It needs to be tested (Secondary Test) to confirm its authenticity. Not recommended to buy here but serves to definitely close shorts.
The Selling Climax represents the moment of maximum panic in the market, where professionals take advantage to accumulate at bargain prices. Identifying it correctly is key to understanding where accumulation begins.
What is the Selling Climax?
Definition
The Selling Climax (SC) represents a very powerful signal of strength that emerges after a prolonged bearish movement. It is the moment where institutional capital considers prices attractive and begins to accumulate at those low levels.
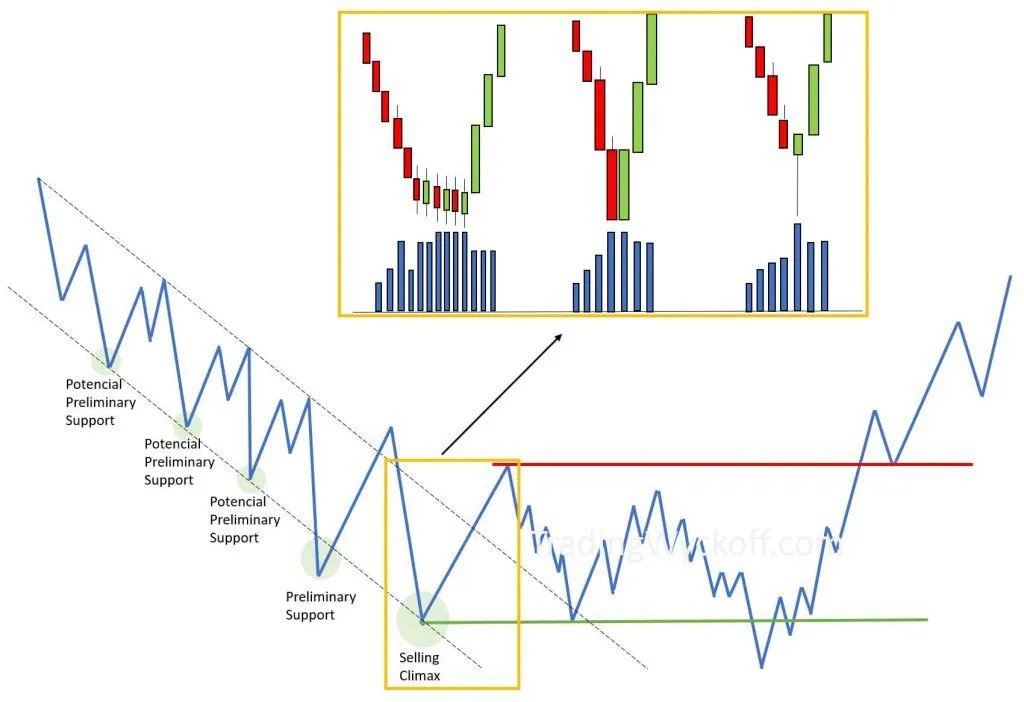
The Selling Climax occurs as the second event after the Preliminary Support within Phase A of trend reversal. This climactic movement results from three combined factors that create a snowball effect of continuous price decline.
Structural importance: The Selling Climax low establishes the lower extreme of the formation, defining the support zone of the accumulation structure.
Key Characteristics
After the SC, two things can happen: an Automatic Rally or a sideways movement. If the Automatic Rally appears, it will be followed by a Secondary Test; on the contrary, if a sideways movement takes place, the market is most likely to continue falling.
Needs Verification
This event needs to be tested to confirm its authenticity. A much lower volume on the subsequent Secondary Test shows decreased selling pressure ("No Supply" in VSA terminology).
May Not Be the Absolute Low
Throughout Phase B, multiple tests may occur, and the Spring/Shakeout in Phase C could make new lows below the SC.
Similar to Preliminary Support
Both how it appears on the chart and the psychology behind it are similar. It should also be initially treated as potential until the Automatic Rally and Secondary Test appear to confirm Phase A.
Key Concept
The contracted volume and range on the subsequent Secondary Test are the most critical indicators to confirm the authenticity of the Selling Climax.
How It Appears on the Chart
Although the principle doesn't change, it can manifest in different ways in terms of price and volume representation.
Within the world of price and volume analysis, the predominant belief is that this event should be observed as a bearish bar with increased volume and range expansion. While this definition is correct, it would be incomplete since there are other forms of representation.
- Bearish bar with expansion: The classic representation with climactic volume (greatly increased) and range expansion
- Group of bars: A cluster of bars with relatively narrower range and high, constant volume throughout all of them
- Bar with lower wick: A single bar with high volume and a large wick at its lower part
All these representations ultimately denote the same thing: strong entry of buying interest by large operators.
Regardless of the Selling Climax characteristics, when we observe the genuine Automatic Rally and Secondary Test, we will automatically label the previous bearish movement as the Selling Climax.
The Psychology Behind the Selling Climax
Remember that due to the very nature of markets, for someone to be able to sell, there must be someone else willing to buy. So it's a good idea now to ask ourselves, for example, who is taking on all that selling and what motivates them to perform such a task.
The Buyers
Logic leads us to think that the one buying is the large operator since they are the ones with the ability to move the market and stop an abrupt fall. They have probably determined that the price is "cheap" and see it favorably to initiate a campaign to accumulate stock in that zone.
Video in Spanish with English subtitles available

What motivates poorly informed operators to provide the liquidity that large operators need with their sales?
Greedy Sellers
There will be a group that sees the price falling and, fearing missing the downward movement, enters with short positions.
Panic Sellers
Another group, generally with medium-long term positions, will have stored stock and will have endured a large part of the decline. They are at a loss and seeing the price fall again, fearing further increasing the loss, they finally decide to abandon their position.
Bargain Hunters
A final group of operators, believing themselves to be the smartest in the class, will want to anticipate the bullish turn and at that point will probably already have long positions. This third type of sales occurs when the protective stop (Stop Loss) of these positions is hit.
The Selling Climax by Exhaustion
A bearish trend won't always end with climactic volume. There is another way to reach its end and it occurs when the selling that is controlling the market condition gradually disappears.
Sellers lose interest in lower prices and close their positions (take profits). This lack of aggressiveness from shorts would create a potential market floor by exhaustion.
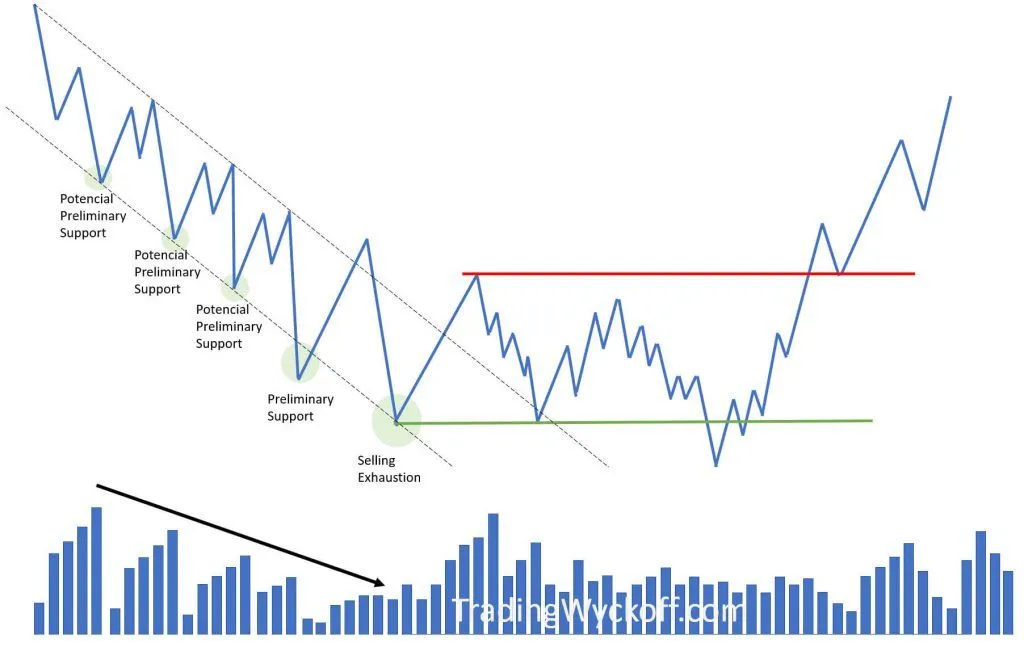
Obviously, this disinterest will be represented on the chart with normal or narrow range candles and average or even low volume.
The curious thing about this action is that, although we are not facing a climactic event that precedes the end of a trend, within the structure labeling we would still identify that low as the Selling Climax.
It should be made clear that the methodology originally does not treat such action as a Selling Climax; and it makes perfect sense because at no time do we observe that characteristic climax.
Although we always advocate treating market actions from a functional point of view, on this occasion we must observe this exhaustion from an analytical point of view in order to frame it within the structure labels.
New Event Proposal
Perhaps we could propose to the entire Wyckoff community a new event that would identify this end of bearish trend by exhaustion. Something like "Selling Exhaustion" could be representative of the action it refers to.
When to Expect Selling Exhaustion?
Notable about Selling Exhaustion is that a signal of its possible appearance is obtained when the price develops continuous Preliminary Support actions that are progressively lower.
Climactic actions will be observed as the bearish movement develops where most likely the overall volume will be decreasing. This suggests that an absorption of sales is taking place where professionals have stopped selling aggressively and are beginning to take advantage of the bearish continuation to take profits from their shorts.
This can cause that market floor to develop without seeing an expansion in price ranges and volume on the last low. We will be facing the new Selling Exhaustion.
Uses of the Selling Climax
Identifying this event is very important as it signals smart buying; buying by professionals and therefore it is quality demand.
What advantage can we gain from correctly identifying this event? Being a stopping action of the previous bearish movement and signaling the entry of quality buying, we can draw two clear conclusions:
- We should stop thinking about the short side at least until later confirming a redistribution scheme
- We are facing the last clear opportunity to take profits from short positions if we didn't do so on the Preliminary Support
Don't Buy Here
It is not recommended to initiate long positions at this point as the assumed risk would be too high. However, it is true that some of the more experienced Wyckoff operators take advantage of this type of context to take short-profit buy trades looking for the bullish bounce toward the Automatic Rally.

Wyckoff Methodology in Depth
This article is an excerpt from the book. If you want to master the Selling Climax and all Wyckoff accumulation events, the book provides all the necessary knowledge with real examples.
View book