Sign of Strength (SOS)
The breakout movement that marks the transition from range to bullish trend, confirming institutional accumulation is complete.

Rubén Villahermosa
Trader and educator
Article Summary
The Sign of Strength (SOS) is the bullish movement originating at the Phase C low (Spring/LPS) and ending by breaking the upper range boundary (JAC - Jump Across Creek). It represents the second change of character, transitioning from range to bullish trend. An effective breakout shows: expanded ranges, elevated volume, no re-entry to the range, and significant distance. The Creek represents the selling pressure that must be crossed. The SOS Bar (wide bullish bar, close at highs, high volume) confirms institutional demand.
After the test event in Phase C (shakeout or LPS), the price will develop a trending movement in the direction of least resistance.
Large professionals have already absorbed all the stock they need for their positions and have verified (through the shakeout and test) that they won't encounter much resistance in the subsequent price advance in their favor.
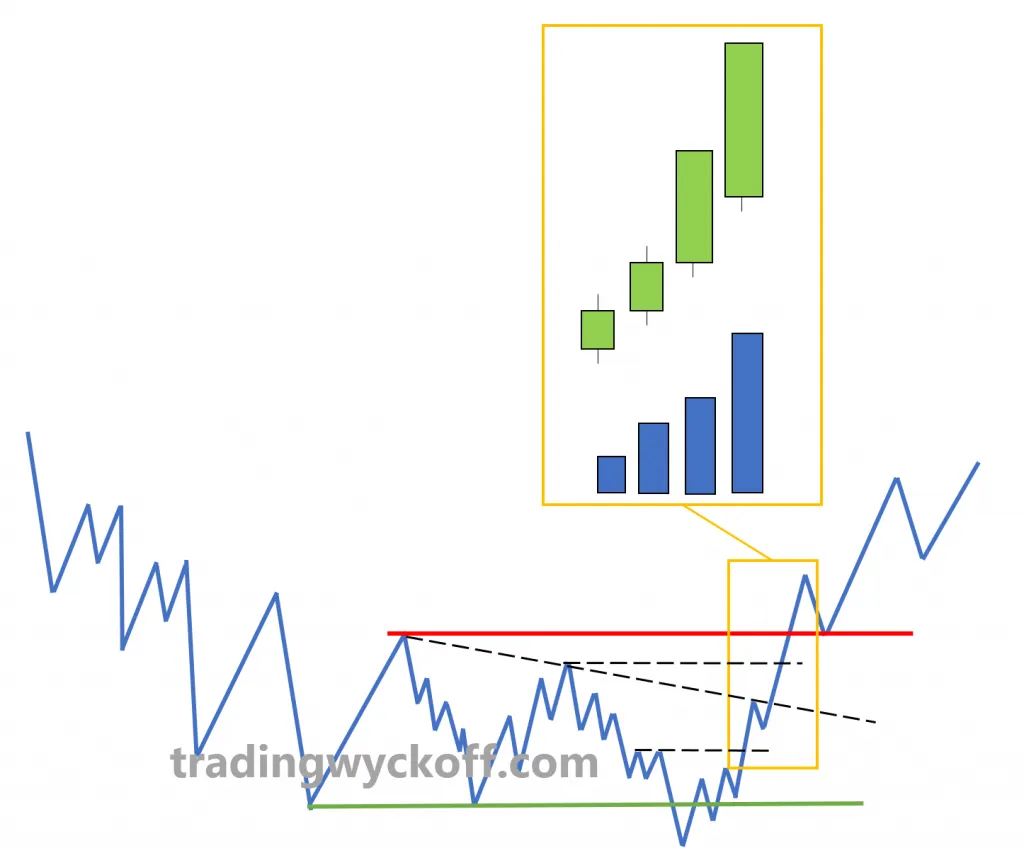
The Sign of Strength marks the breakout movement that initiates the bullish trend after the accumulation range
Can We Determine If a Breakout Will Be False or Effective?
The market is in disequilibrium and this causes a strong movement that breaks the structure, initiating the development of the cause that has been previously built.
This breakout movement itself is not a trading opportunity; it only alerts us to a possible opportunity in the very near future. This opportunity is found in the immediate action, in the confirmation test.
Change of Character
This is the second Change of Character (ChoCh) of the structure. Remember that the first occurs with Reaction Event #2, where the market transitions from a trending state to a range context.
On this occasion, this new ChoCh changes the market context by ending price lateralization and initiating a new trending phase.
The ChoCh is not just a strong movement; it is composed of two events: a strong movement and a slight pullback. This combination forms the ChoCh. We identify the change of character from the origin of Phase C to the end of Phase D.
How It Appears on the Chart
We are in a velocity environment and this causes this movement to develop through candles showing a relative increase in price ranges as well as an increase in volume.
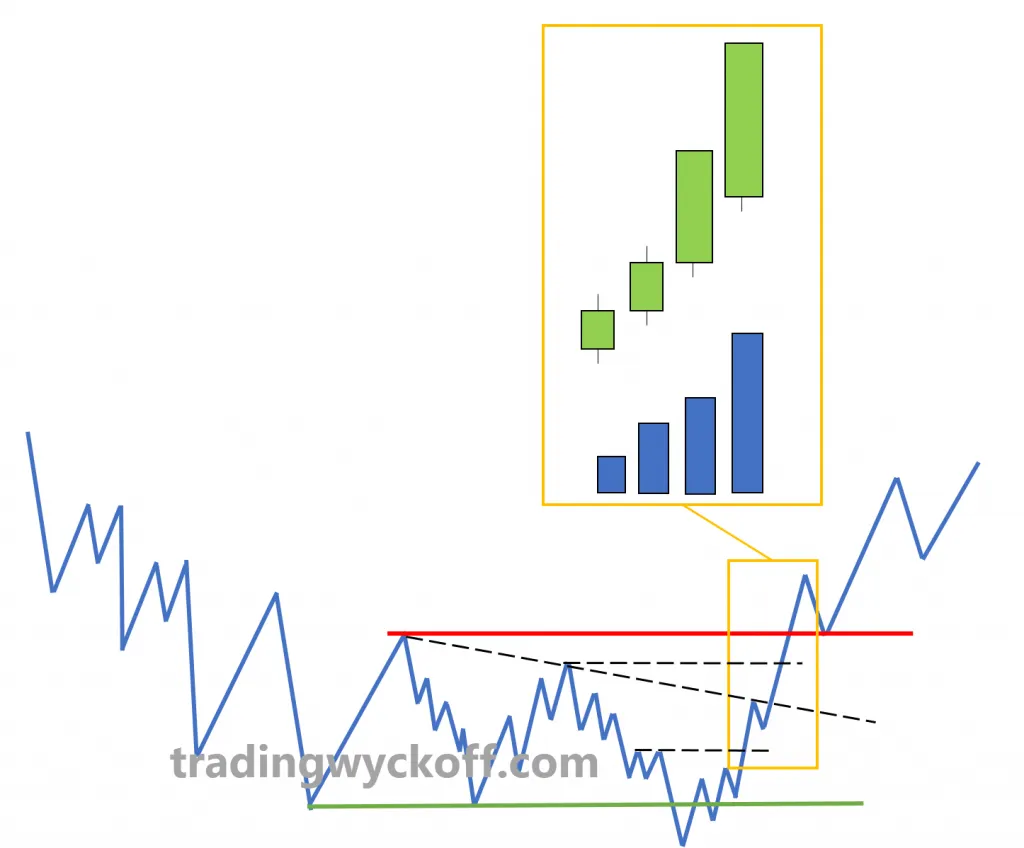
This movement will fluidly break previous liquidity levels, denoting strong momentum. It is the representation of market disequilibrium and the aggressiveness shown by operators.
The Breakout Without Volume
Generally, breakouts should occur with increasing volume, although it's true that sometimes we could see such actions without an especially elevated volume increase. This suggests that the available stock is essentially low and therefore the operators in control won't need to make any special effort to easily move the price.
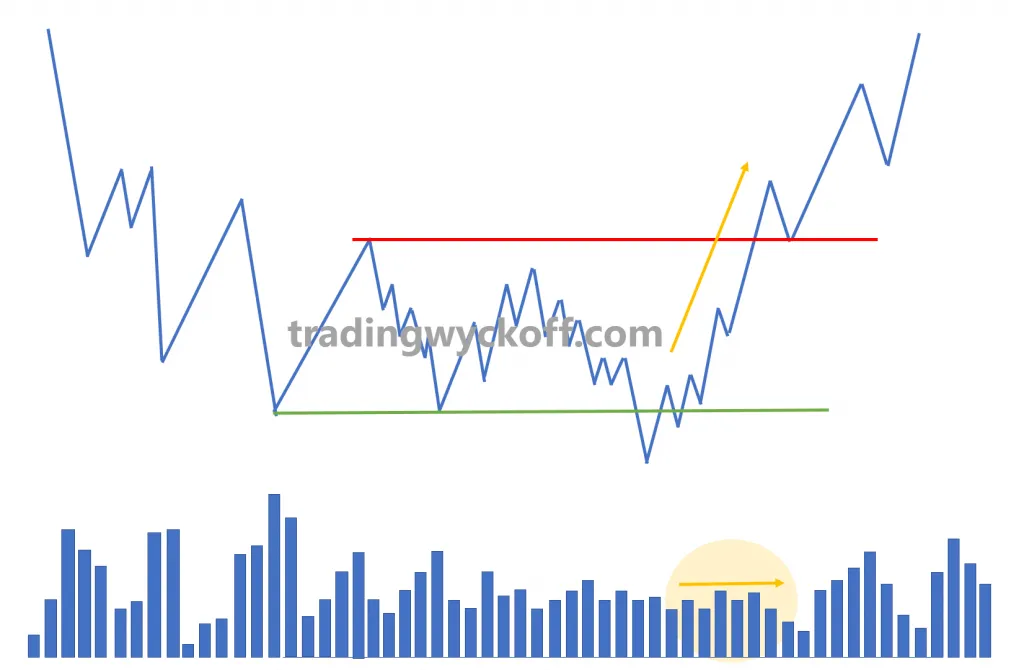
For the bullish breakout example, if we see it occurs with narrow-range candles and average volume, we should initially distrust its intentionality; but what might be happening is that there's very little floating supply, meaning there are very few operators willing to sell. Then, the absence of sellers along with moderate buyer aggressiveness can cause that upward breakout without relatively high volume.
Video in Spanish with English subtitles available

Key Breakout Elements
This is a key moment since we could be facing a potential shakeout event, which is why making a judicious evaluation of price action and volume after the breakout is essential. To do this, we can use some indicators:
No Immediate Re-entry to the Range
This is the most reliable signal of intentionality. We look for an effective breakout to stay outside the range and fail in its attempts to re-enter the equilibrium zone.
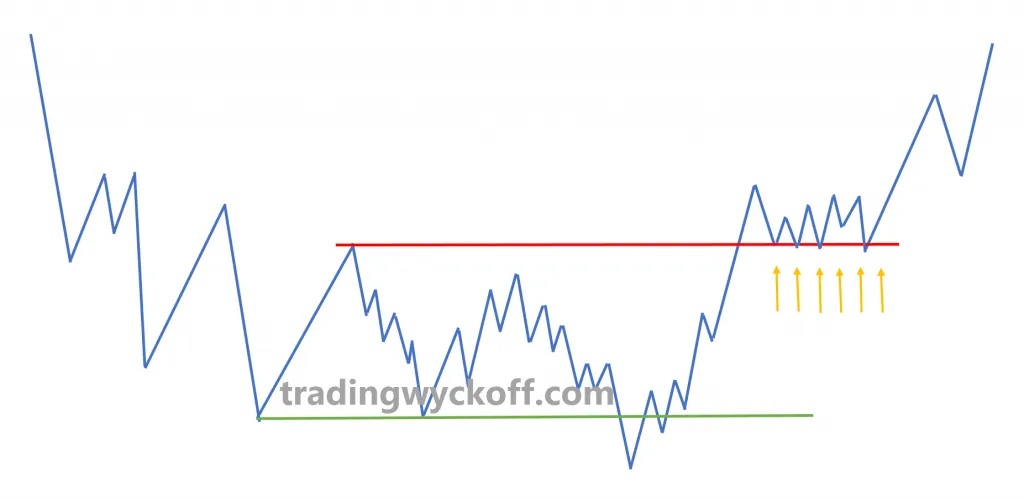
In addition to observing that the movement is accompanied by an increase in price ranges and volume, and that it breaks previous control zones (previous highs and lows and minor Creeks), the most powerful indicator to assess the breakout as genuine is that the price manages to stay outside the range.
It denotes that there has ceased to be interest at lower prices and confirms that the movement is being supported by large operators.
Representation of Lack of Interest
Another indicator that would add strength to the effective breakout would be to subsequently observe candles without intentionality: narrow range, intertwined, and with lower volume than seen during the breakout movement.
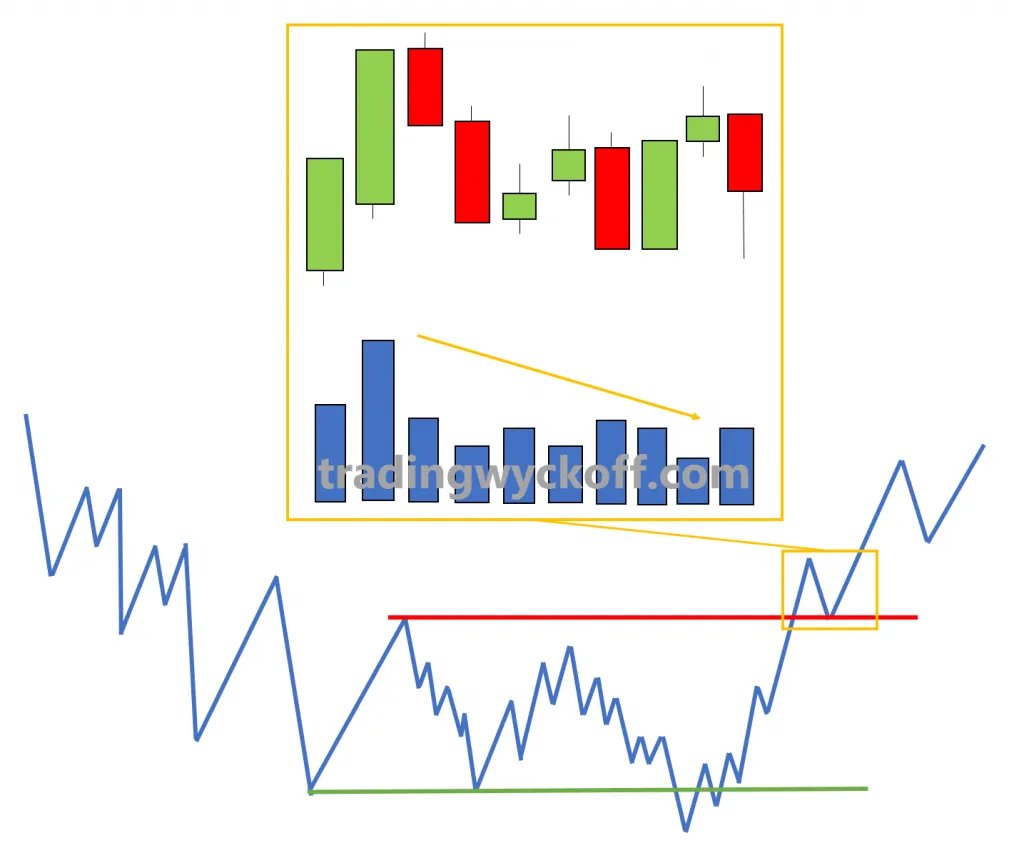
Breakout Distance
On the other hand, the distance the price manages to travel could be another indicator to consider. Although there's no predefined distance, the distance covered should be evident. That is, a breakout that manages to move quite a few points away from the structure gives us greater confidence.
The Breakout Does Not Offer an Opportunity
In operational terms, this action does not represent a trading opportunity. This is mainly because it is in a delicate zone where an enormous amount of order crossing will be occurring and market control could change.
What initially appears to be an effective breakout could turn into a shakeout. And this is why it's more convenient to wait for the subsequent test to definitively confirm the action.
Market Uncertainty: Even so, it's obviously not guaranteed that the trade will be successful. The market is an environment of constant uncertainty and is completely out of our control. As discretionary traders, the only thing we can do is accumulate indicators that favor one side or the other having control to try to position ourselves. In the end, it's a matter of probabilities.
Sign of Strength
SOS Definition
The Sign of Strength (SOS) is a bullish movement that originates at the Phase C low (Spring or LPS) and ends by producing the breakout of the upper part of the range (JAC - Jump Across the Creek).
All of this generates the change of character prior to the start of the bullish movement outside the range. It is followed by a pullback to the broken Creek to generate the BackUp (BU) or BackUp to the Edge of the Creek (BUEC) action. If it fails to stay above that zone and re-enters the range, the event would be an Upthrust (UT).
A great show of strength denotes an urgency of institutions to enter. They are very bullish and buy aggressively.
To assess that we could really be facing an SOS, we want to see that the bullish movement has ease of movement and reaches the midpoint of the range. Additionally, any pullback now should remain above the Spring low to demonstrate strength.
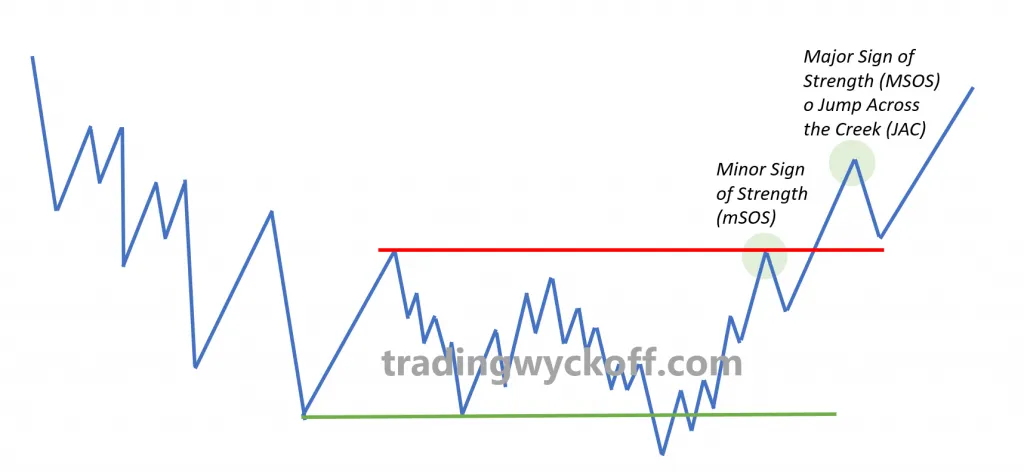
Minor SOS
In case the bullish movement fails to break the structure, this movement would be labeled as minor Sign Of Strength (mSOS).
If during Phase B we observe a movement with SOS characteristics, we could also label this event as minor SOS.
Sign of Strength Bar
SOS Bar Definition
It is a bullish bar with wide range, close at highs and increased volume; although it could also be a bullish gap.
It signals the presence of strong quality demand. It is the institutional buying point.
It could be used as an entry trigger. If in an operating zone (after shakeout, after breakout and in trend) we observe a strength bar (SOS Bar), it is the definitive signal that large professionals are supporting the upward movement and provides us with a good opportunity to go long.
Sign of Weakness
Major Sign of Weakness
The Major Sign of Weakness (MSOW) is a strong bearish movement whose origin is at the Phase C high (UTAD or LPSY) and causes the breakout of the lower part of the range (ICE) to initiate a new bearish trend.
It signals seller aggressiveness and is therefore a professional selling point.
The main use we can give it is as an entry trigger for short operations. If in an operating zone (after shakeout, after breakout and in trend) we observe a weakness bar (SOW Bar), it is the definitive signal that large professionals are supporting the downward movement and provides us with a good opportunity to short sell.
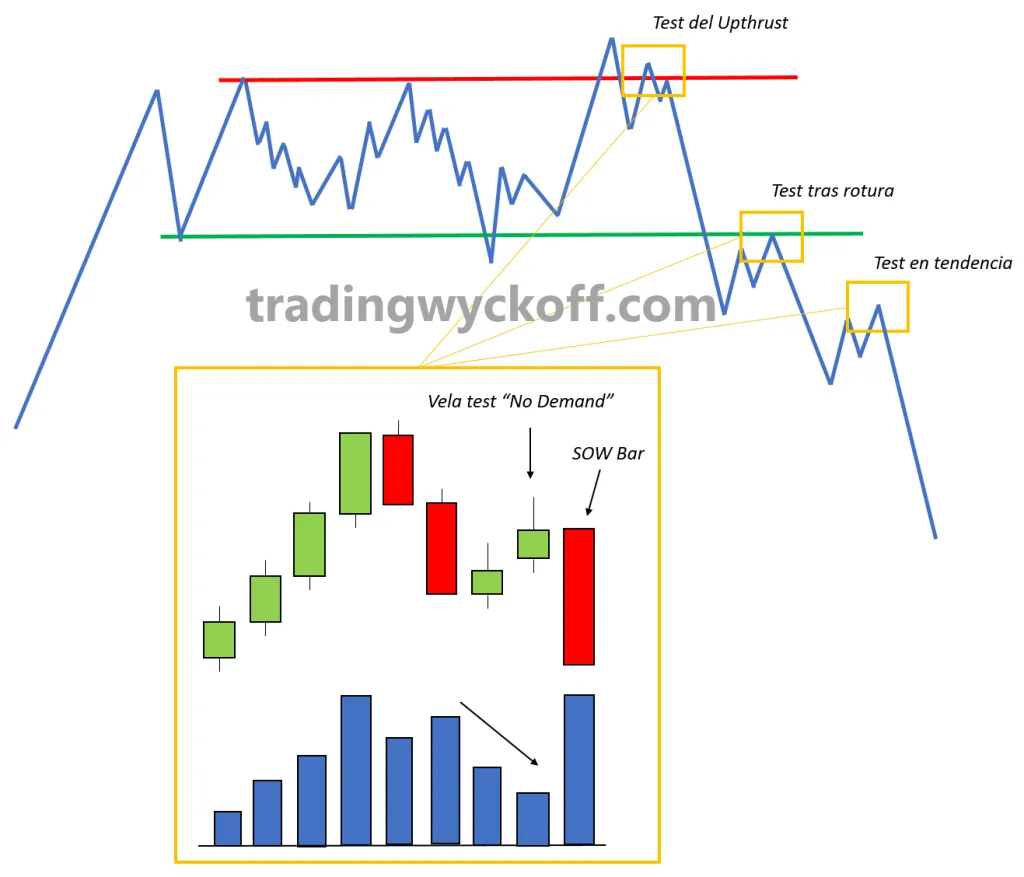
The SOW Bar is a wide-range bearish bar, close at lows and high volume that signals institutional selling
The Creek Analogy
Prices behave differently when a trend begins. Each price bar tells a story during the accumulation range action and each bar tells a different story when the bullish trend starts.
"A great bullish trend is born within a discrete area of accumulation. The keen eye of a Wyckoff operator is able to detect this change in behavior as the trend begins, and initiate a campaign in the asset."
- Wyckoff Methodology
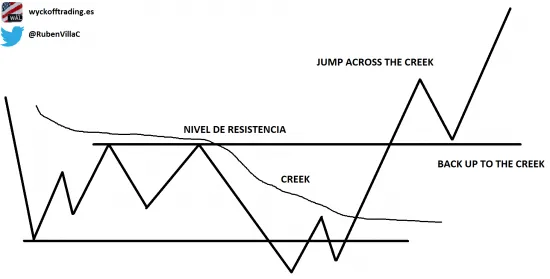
In an accumulation range, the forces of supply keep the price repressed. Supply is not a linear phenomenon; it doesn't always appear at fixed prices.
Large market operators understand that large supply will appear to stop the price advance causing its return to previous support levels. Each attempt to rise may encounter supply at different price levels within the accumulation area.
Robert Evans took charge of Wyckoff Associates (the company founded by Wyckoff; which became the Stock Market Institute in the early 50s). Evans was a master of the Wyckoff methodology. He used memorable analogies and stories to convey important concepts.
The Boy Scout Story
The colorful story of the Creek conveys the nature of threatening supply in the accumulation range. It tells the story of a Boy Scout walking through the woods along the banks of a creek. To continue toward his destination, the explorer must find a place to cross to the other side of the creek.
But the creek (the asset's supply) is too wide and he needs to get a running start to jump to the other side. So he continues walking along the creek; sometimes he moves away and then returns to find the right place.
Finally the creek narrows enough for the Boy Scout to determine he can jump. At the narrowest point, he moves away from the bank to get a running start and jumps to the other side.
Upon landing, the momentum of his run carries him away from the bank; but he decides to take a rest and returns to the creek bank, takes off his shoes and puts his feet in the water.
After resting, he continues his journey. The creek stops representing a barrier (resistance) on his journey toward his destination (higher prices).
The Creek as Selling Pressure
Of course, the Creek story is about the pressure of supply to prevent prices from beginning the bullish trend. A dramatic event is necessary to put prices on the other side of the creek.
The creek meanders through the forest turning here and there, while becoming wide and then narrow. Supply works the same way.
A wavy line can be drawn above price highs when they turn down from selling pressure. That wavy line would look like the real creek and represents our Creek.
Price will reach a place where the last purchases will occur (a Spring or an LPS) and then jump to the other side absorbing the remaining supply.
This jump (as Evans called it) is characterized by having an expansion in bars and an impulse in volume (the energy required to absorb the remaining supply). For a Wyckoff operator, those price and volume attributes are different from those seen before during the range and indicate that a trend is emerging.
The Composite Operator (CO) is embarking on a long-term trend in the asset, and the Wyckoff analyst can see this in the change of behavior in price and volume. This is the moment for action.
The Double Creek
Sometimes a Creek will split into two, one lower and one upper. Accumulation ranges will sometimes have two supply areas (two Creeks) that must be crossed.
The resistance line is sometimes in the price area where another selling impulse will appear to stop the advance. Once this resistance area is overcome, the asset will have completely cleared the accumulation area and will be emerging in a bullish trend.
Ironically, as the Composite Operator is accumulating, the majority of the public becomes increasingly pessimistic. The jump (JAC-Jump Across the Creek) and the pullback (BUEC-BackUp to the Edge of the Creek) are the events that alert us that the asset is ready to initiate the bullish movement through the resistance line and onward.
Tips for Creek Analysis
Compare the movements
Compare the bullish and bearish movements within the range with the one that takes price to the Creek. The movement toward the Creek must show an expansion in price ranges and volume on bullish movements and a contraction on bearish ones.
After the JAC comes the BUEC
A slight pullback during the BUEC is a good sign and indicative of the change of character in prices. A JAC is synonymous with SOS (Sign of Strength) and BUEC is synonymous with LPS (Last Point of Support). They can be used interchangeably.
If after a Spring the movement doesn't expand volume
It won't be labeled as JAC. When the upper Creek is jumped with a volume increase, this movement is a major SOS.
The Creek connects the highs
A line drawn connecting price highs represents supply pressing to turn the price down. This Creek must be jumped with good price range and volume showing demand.
If volume remains high after Spring and ST
It indicates that supply is present and thus it's impossible for the jump to occur.

Wyckoff Methodology in Depth
This article is an excerpt from the book. If you want to master the Sign of Strength, Creek analysis and all breakout events, the book provides all the necessary knowledge with real examples.
View book