Smart Money Concepts (SMC): Complete Guide
Discover what SMC really is, where it comes from, its core concepts (Order Blocks, FVG, BOS/CHoCH, liquidity, killzones) and how it relates to Wyckoff.

Ruben Villahermosa
Trader and educator
In this article
Article Summary
Smart Money Concepts (SMC) is a price-action trading methodology that operates by following the footprint of institutional capital on the chart. Its core elements are Order Blocks, Fair Value Gaps, liquidity sweeps and structure shifts (BOS, CHoCH, MSS). It was systematized in the 2010s by Michael Huddleston (ICT) and is most often applied to Forex, indices and crypto on intraday timeframes during specific institutional sessions (killzones).
What you'll learn in this article
You'll discover what SMC is, its real origin (more complex than most people think), its core concepts (Order Blocks, FVG, BOS/CHoCH, MSS, liquidity, PD Arrays, OTE, killzones), the real differences with Wyckoff, the term-by-term equivalences, and how to combine both approaches to trade with an edge over the average SMC trader.
What is Smart Money Concepts (SMC)?
SMC Definition
Smart Money Concepts (SMC) is a price-action trading methodology that identifies the footprints left by large institutional operators — banks, investment funds and hedge funds — on the chart, in order to trade in their direction. Its core consists of four elements: Order Blocks (zones where the institution placed orders), Fair Value Gaps (price imbalances), liquidity sweeps (stop hunts) and structure shifts (BOS, CHoCH, MSS). It was systematized in the 2010s by Michael Huddleston, known online as Inner Circle Trader (ICT), and exploded as a mass phenomenon from 2018-2020 thanks to YouTube, Discord and social media.
SMC stands out for its operational premise: the market doesn't move randomly, but is driven by these large operators, who leave specific footprints on the chart when they accumulate or distribute positions. The job of the SMC trader is to recognize those footprints and align their trades in the same direction as professional capital.
The fundamental premise of SMC
SMC is built on three interconnected ideas:
The market is directed, not random
Price doesn't move from the chaotic sum of individual retail decisions, but from the planned execution of large institutional orders that need liquidity to be filled.
Institutions need liquidity
To execute large positions without moving price against themselves, institutions need counterparties. Previous highs and lows concentrate stops and pending orders: they are liquidity pools that must be "harvested".
The real move comes after the sweep
After capturing the necessary liquidity, price reverses in the real direction institutions wanted. This post-sweep reversal is the high-probability entry for the SMC trader.
The golden rule of SMC: Don't look for the breakout, look for the sweep. When you see price break a key level with force and reverse immediately, you're probably watching an institutional liquidation. The real move goes opposite to the sweep.
Why did SMC become so popular?
The rise of SMC isn't accidental. Several factors converge:
- Fresh, rebrandable terminology: "Order Block" sounds more sophisticated than "demand zone"
- Fits perfectly with 24h Forex and crypto, where real volume is hard to read
- Democratization via YouTube: thousands of free hours explaining each concept
- Ideal for funded prop firms that operate on lower timeframes with tight stops
- Clear visual rules: identifying patterns is easier than interpreting volume
- Massive community on Discord, Twitter and Telegram that reinforces learning
The flip side of the boom
The popularity of SMC has created a parallel industry of course sellers with unrealistic promises. There are great serious educators, but also a lot of smoke. Learning the original principles (Wyckoff) protects you from falling into distorted versions of SMC sold at outrageous prices.
What is the real origin of SMC?
The official story circulating on YouTube says "ICT invented SMC". The reality is more nuanced and more interesting. SMC is the result of almost a century of evolution of the same central idea: markets are driven by a small group of very well capitalized participants, and reading their footprints is the key to success.
Richard Wyckoff (1910-1934): The conceptual origin
Richard Wyckoff was a trader and financial journalist who founded The Magazine of Wall Street and devoted the 1910-1930 decades to studying and documenting the behavior of the large operators of the time (Jesse Livermore, J.P. Morgan, Andrew Carnegie, among others).
Wyckoff and the term "smart money"
Richard Wyckoff popularized the use of the term "smart money" in his writings of the 1920s-1930s to distinguish large institutional operators from the general public. Although there's no historical consensus on who exactly coined the term first, it was Wyckoff who turned it into a central trading concept and spread it widely through his courses and publications.
Wyckoff created the concept of the Composite Man: a fictional entity representing all institutional operators trading as if they were a single individual. The Composite Man accumulates at low prices, manipulates through maneuvers and distributes at high prices. This concept is, letter by letter, the philosophical foundation of SMC.
"All market fluctuations should be studied as if they were the result of one man's operations. Let us call him the Composite Man. He operates against the public, manipulating price to accumulate at low prices and distribute at high prices."
— Richard Wyckoff, The Richard D. Wyckoff Method of Trading in Stocks, 1930s
Larry Williams (1970s-1980s): The forgotten link
Larry Williams is one of the most influential and least recognized traders in the SMC evolutionary chain. He won the 1987 World Cup Trading Championships turning $10,000 into more than $1,100,000 in 12 months, and devoted decades to studying the behavior of "big money" in futures.
Little-known historical fact
Michael Huddleston adopted the name "Inner Circle Trader" directly from Larry Williams' "Inner Circle Workshop" educational program, which existed decades before ICT appeared on YouTube. Huddleston was inspired by the concept, adopted the name and built his personal brand around it. This connection is rarely mentioned in SMC tutorials, but it's a verifiable fact documented in interviews with Huddleston himself.
Larry Williams introduced concepts such as Turtle Soup (trading against failed 20-day breakouts), the Oops Signal (trading against opening gaps), and his work on Commercials vs Large Specs in the COT Report. All these concepts share DNA with modern SMC.
Linda Raschke (1990s): Systematizing the fade
Linda Bradford Raschke, one of Wall Street's most respected traders and a Williams protégé, systematized the concept of trading false breakouts in her book "Street Smarts" (1995) with Laurence Connors. Her Turtle Soup is, functionally, a direct precursor of SMC's Liquidity Sweep: identifying when price breaks an extreme and fails, to trade the reversal.
The same pattern, three different names: What Raschke called Turtle Soup in 1995, what SMC has called Liquidity Sweep since 2010, and what Wyckoff identified as Spring (shakeout below support) and Upthrust (shakeout above resistance) in the 1930s, are exactly the same phenomenon: a sweep into a zone where liquidity (stops) accumulates, followed by a reversal in the opposite direction. The pattern is universal; only the label changes depending on the methodology that documents it.
Michael Huddleston / ICT (2010-2018): Modernization
Michael J. Huddleston, born in St. Joseph, Michigan, doesn't come from the traditional financial world. His uncle — a successful commodities trader — introduced him to the markets after years working restocking vending machines. He started publishing on YouTube under the alias Inner Circle Trader in the early 2010s, with a groundbreaking proposition for the time: teaching institutional price action for free in long videos (2-4 hours) breaking down each concept.
What Huddleston did was:
- Take Wyckoff's principles of accumulation/distribution and manipulation
- Translate them into a modern language accessible to the digital trader
- Add Forex-specific concepts (killzones, sessions, pairs)
- Introduce his own terminology (Order Blocks, FVG, Liquidity Pools, PD Arrays, IPDA)
- Build complete frameworks like Power of 3 and OTE
- Systematize trading hours based on the opening of institutional banks
The uncomfortable truth about ICT: Michael Huddleston didn't "invent" SMC concepts from scratch. He took them from previous sources (Wyckoff, Williams, Raschke, Larry Pesavento, Steidlmayer himself with Market Profile) and packaged them into a modern framework with his own terminology. That's not a demerit: systematization and dissemination have enormous value. But it does qualify the narrative of a "lone genius decoding the markets".
The SMC community (2018-present): Mass simplification
From 2018 onwards, the explosion of YouTube, Discord and Twitter democratized ICT concepts. Dozens of traders (some direct students of Huddleston, others derivatives) started producing content simplifying the original framework:
- Original ICT: complex, 200+ interconnected concepts, requires months of study
- Community SMC: simplified to ~20 key concepts, learning curve of weeks
- "Mainstream" SMC: reduced to Order Blocks + FVG + BOS + Liquidity Sweep
The term "SMC" (Smart Money Concepts) started being used as a synonym for "the lite, accessible version of ICT". Today most tutorials you consume under the SMC label are at least two levels of abstraction away from Huddleston's original work — and his work, in turn, is two levels away from Wyckoff.
The complete evolutionary line
| Decade | Innovator | Contribution | Application |
|---|---|---|---|
| 1910-30 | Richard Wyckoff | Composite Man, Spring/Upthrust, Phases, Volume | Macro structures |
| 1970s-80s | Larry Williams | Inner Circle Workshop, COT, reversals | Futures, commercials |
| 1990s | Linda Raschke | Turtle Soup, fade systematization | Swing trading |
| 2010-18 | ICT (M. Huddleston) | Order Blocks, FVG, PD Arrays, Killzones | Forex Daytrading |
| 2018+ | SMC community | Simplification, rebranding, mass adoption | Retail mass |
| 2024+ | CRT (Candle Range Theory) | Extreme simplification to a single pattern per candle | Individual candles |
Historical conclusion: SMC is not a recent invention by Huddleston. It is the fourth iteration of a century-old idea: the market is driven by large operators, and reading their footprints is possible. Each iteration added value (systematization, dissemination, tools) but also subtracted depth (especially volume analysis, which was central in Wyckoff and was lost in SMC).
What are the fundamental principles of SMC?
Before getting into specific patterns, it's critical to understand the four conceptual principles that underlie all SMC concepts. If you master these principles, all the patterns will feel intuitive. If you ignore them, you'll apply SMC as a blind recipe that fails in atypical conditions.
Principle 1: The market seeks liquidity
Principle #1
Price moves toward liquidity. Previous highs and lows are magnets: they contain retail stops and pending institutional orders. Price will tend to visit those levels to "harvest" that liquidity before moving in the real direction.
This principle explains 80% of the shakeouts you see on the chart. It's no coincidence that price sweeps just below the previous low and then rises. It's market mechanics: institutions need that liquidity to execute their large positions.
Principle 2: Price moves through imbalances
Principle #2
When price moves fast and hard in one direction (displacement), it leaves imbalance gaps where there was no fair trade between buyers and sellers. The market will tend to return to those gaps to "fill them" before continuing.
This principle is the basis of Fair Value Gaps (FVG). When you see a very large-bodied candle breaking structure, mark the imbalance zone: it will be a likely retest.
The real origin of the concept: Order Flow. The idea of "imbalance" is not an SMC invention. It comes from Order Flow studies, where price levels with zero contracts traded are identified — the true market inefficiency. If you observe the footprint of a displacement candle, you'll see there's a specific level with volume 0: that's where price "jumped" without trading. That zero is the theoretically valid level to retest. The FVG is the visual approximation of that concept from candle charts, when you don't have access to Order Flow data.
Principle 3: Structure reveals intent
Principle #3
The sequence of highs and lows on the chart reveals the market's "intent". Higher highs and higher lows = bullish intent. Lower highs and lower lows = bearish intent. A change in this sequence (CHoCH) signals a regime change.
SMC trades "with the structure". If the structure is bullish, you only look for longs. If it changes to bearish (CHoCH), you wait for confirmation before flipping bias.
Historical root: pure Price Action. Reading structure through sequences of highs and lows is not a contribution of SMC or ICT. It's a universal Price Action concept, documented decades earlier by authors like Charles Dow (Dow Theory, late 19th century), Wyckoff himself, Richard Schabacker and later Al Brooks. SMC simply rebranded the concept with its own terminology (BOS, CHoCH) but reading bullish/bearish structure by the sequence of highs and lows is as old as modern technical analysis.
Principle 4: The session defines behavior
Principle #4
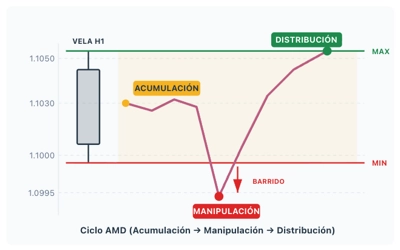
Trading sessions (Asia, London, New York) have characteristic behaviors. Accumulation tends to happen in Asia (narrow range), manipulation at the London open (liquidity sweep), and distribution in the New York session (real directional move).
This principle is particular to SMC and reflects the operational logic of large operators: not all hours of the day are equal. Institutional liquidity concentrates in specific time windows, and price behavior changes depending on the active session. An identical SMC setup has very different probabilities of working depending on whether it forms during the London open, during the New York lunch hour, or during the low liquidity of the Asian session.
This conceptual framework is what SMC knows as Power of 3 (AMD): each trading day typically develops in three sequential phases — accumulation in Asia (narrow range, low volume), manipulation at the London open (sweep of the Asian range liquidity), and distribution in New York (real directional move of the day). This structure is not random: it coincides with the hours when the major banks of London and New York execute their most important orders, and that's why killzones (windows of maximum institutional activity) are the most discriminating filter in SMC. Trading outside a killzone equals, statistically, trading against the very logic of the method.
Market Structure: BOS, CHoCH and MSS
Market structure is the first concept any SMC trader must master. It's the map that defines which direction to trade and when to reconsider that bias. SMC distinguishes three types of structural breaks that are often confused with each other: BOS, CHoCH and MSS. As we already pointed out in Principle 3, structure reading by sequence of highs and lows comes from classic Price Action (Dow, Wyckoff, Schabacker, Brooks); SMC simply rebrands it with its own initials.
Bullish vs bearish structure
- Bullish structure: sequence of higher highs and higher lows (each new high exceeds the previous one and each pullback halts above the previous low)
- Bearish structure: sequence of lower highs and lower lows (each new high is lower than the previous one and each rally stays below the previous high)
- Range structure: oscillation between a high and a low without new breaks in either direction
Break of Structure (BOS): Continuation
BOS — Break of Structure
A BOS occurs when price breaks the last relevant high in an uptrend, or the last relevant low in a downtrend. It is a continuation confirmation: the market's intent remains the same and each BOS validates that the trend is healthy.
A bullish BOS after accumulation is the classic confirmation of Wyckoff's Sign of Strength (SOS). It's not a coincidence: they are exactly the same event with different names.
CHoCH and MSS: same break, different intensity
Here comes the nuance that confuses most SMC traders. CHoCH and MSS break the SAME level. The only difference between them is how that break occurs.
CHoCH — Change of Character
A CHoCH is the first break against the prevailing trend. In an uptrend, price forms an upward impulse and a pullback that leaves a higher low (the last low before price went up again). When that higher low is broken downward, a bearish CHoCH occurs: the "higher lows" pattern has failed, the uptrend loses its character. In a downtrend it's the mirror image: the last lower high is broken upward.
MSS — Market Structure Shift
An MSS breaks exactly the same level as a CHoCH, with one key difference: the break occurs with displacement, that is, with one or several large, strong-bodied candles that pierce the level decisively, not with a simple wick or small candle. The MSS is, in essence, a violent CHoCH: the regime change happens with very clear institutional conviction.
The key to not confusing them:
- • Same level broken (the last higher low in an uptrend, the last lower high in a downtrend)
- • Different speed and conviction of the break
- • Soft break, with wick or normal candles → CHoCH
- • Violent break, with large-bodied candles and displacement → MSS
That's why MSS gives more confidence: when you see a huge candle splitting structure, the market is telling you unequivocally "there's a real change here". A soft CHoCH can be fake; a well-formed MSS rarely is.
Operational relationship between the three
- BOS — prevailing trend continues (breaks the last high in uptrend, the last low in downtrend)
- CHoCH — possible trend change (breaks the last higher low in uptrend, or the last lower high in downtrend; soft break)
- MSS — high-conviction trend change (same level as CHoCH, but with displacement candle)
The three types of break
Practical rule: In your daily operations, identify the CHoCH first on the analysis timeframe (H4/H1) to detect possible bias changes. If that same level breaks with displacement (MSS), your confidence in the change multiplies. Once the new trend is established, each subsequent BOS serves to extend targets and confirm everything remains in order.

A BOS with participation, or an empty BOS?
On candles, a structure break with no participation looks a lot like one with real initiative. The difference lies in futures volume and order flow: whether the break came with effort or was a sweep with no follow-through. I check it in NinjaTrader, which you can download for free and use at no cost for charting, backtesting and simulation.
Affiliate link · paid partnership with NinjaTrader · #ad #NinjaTraderPartner
Order Blocks: The Star Concept of SMC
The Order Block (OB) is, by far, the most popular SMC concept and probably the most important. It's also the most misinterpreted. A well-identified Order Block is a high-probability entry zone; a badly identified Order Block is an excuse to force trades that have no basis.
Precise definition of an Order Block
Order Block — Strict definition
A valid Order Block is the last opposing candle before an impulsive move with displacement that breaks structure. It is not simply "a candle before a rally". Three simultaneous conditions: last opposing candle + strong impulse + confirmed structural break.
Distinguishing between a valid Order Block and "a candle that looks like an OB but doesn't meet the conditions" is the difference between trading a high-probability zone and trading noise.
The three mandatory conditions of a valid Order Block
Last opposing candle to the subsequent direction
In a bullish OB, the last bearish candle before a strong upward move. In a bearish OB, the last bullish candle before a strong downward move. If there are multiple consecutive opposing candles, the OB is the set (or the most prominent one).
Displacement — impulsive move
The subsequent move must be strong, with large-bodied candles. A weak or slow displacement invalidates the OB's probability. Ideally, the candle following the OB should be a powerful directional candle.
Break of structure (BOS)
The move must break a previous structural swing. Without BOS, you're not confirming the market's intent changed: you're just seeing intra-range noise.
Order Block step by step (bullish and bearish are mirrors)
The process is identical for bullish and bearish OBs, only the direction changes. In practice the same phases apply, inverting the terms:
Identify the Order Block
Locate the last candle opposing the impulse (bearish before a bullish impulse for a bullish OB; bullish before a bearish impulse for a bearish OB). It must meet the three conditions: last opposing candle + displacement + confirmed BOS.
Mark the exact range of the OB
Draw the range from the open of the OB candle to its low for bullish (or to its high for bearish). That range generates 3 key points: proximal line, distal line and Mean Threshold — defined in detail right below.
Wait for price to return and mitigate the zone
Price tends to return to mitigate the OB before continuing in the impulse direction. That mitigation is your setup: no return, no trade.
Choose your entry method (3 recognized options)
There are three documented ways to enter an Order Block, with different price vs reliability trade-offs. They are detailed below.
The 3 key points of the OB range
Once the Order Block range is marked, you identify three reference levels you'll use constantly:
- • Proximal line: the edge closest to the impulsive move. In a bullish OB it's the open of the bearish candle (upper edge of the range); in a bearish OB it's the open of the bullish candle (lower edge). It's the first level price touches when returning to mitigate the zone.
- • Distal line: the edge farthest from the impulsive move. In a bullish OB it's the low of the bearish candle (lower edge); in a bearish OB it's the high of the bullish candle (upper edge). It's the level that, if broken, completely invalidates the OB and determines the stop loss placement.
- • Mean Threshold (50%, also called Equilibrium): the exact midpoint of the OB range. It's the reference level for partial invalidations: if price closes a candle beyond 50%, many traders consider the zone "worked" and prefer to close the trade before the full SL triggers.
Body only or full range? The three variants
This is a frequent and legitimate question: there are three ways to mark the Order Block range depending on the school:
- Open-to-low (the ICT standard, most widespread): from the open of the candle to the low (in a bullish OB), or from the open to the high (in a bearish OB). Includes body plus one wick, but not the wick on the side opposite the impulse.
- Body-only: from open to close, ignoring wicks. A stricter approach, used by some traders who consider wicks "noise" and not relevant.
- Full range (high-to-low): the entire candle range, including both wicks. The most permissive, gives wider zones but with less entry precision.
Practical recommendation: use open-to-low (the ICT standard). If price slightly sweeps the low before reacting, that's the expected behavior of a manipulation prior to institutional entry. The body-only variant produces too many false negatives by ignoring that key wick.
The 3 entry methods on an Order Block
There is no single correct method
ICT/SMC communities recognize three valid approaches to enter an Order Block. They are not mutually exclusive: you can use one or the other depending on your risk profile and the quality of the confluence. Knowing all three lets you choose the right one for each situation.
Method 1 — Aggressive entry (limit order at proximal)
A buy limit order is placed directly at the proximal line of the bullish OB (upper edge of the range), without waiting for confirmation. It's the method that offers the best entry price and best R:R ratio, but accepts that many times the zone doesn't react and the stop is triggered.
Method 2 — Conservative entry (buy stop after confirmation)
Wait for price to enter the OB range, form a confirmation candle (clear rejection, long opposing wick, deceleration) and place a buy stop above the high of that bearish confirmation candle. You sacrifice a few pips of entry in exchange for greater reliability: the reaction is already confirmed before entering.
Method 3 — Confirmation on lower timeframe
The most used by professional traders. Wait for price to reach the Order Block on the analysis timeframe, drop down to M5 or M1 to look for a bullish structure shift (CHoCH/MSS on short timeframe) within the OB zone. The entry is taken on the retest of the mini-OB or FVG that forms after that structure shift. Combines entry precision with real confirmation of institutional intent.
Recommendation
For most traders, Method 3 is optimal: better win rate without sacrificing as much price as Method 2. Method 1 only if the OB is very clean and aligned with the macro context (for example, after a clear liquidity sweep in a high-activity session). Method 2 is the recommended default if you're learning and don't yet master lower timeframes.
Stop Loss: where exactly
General rule for SL on a bullish OB
The stop loss is placed a few pips (or ticks) below the OB distal line, that is, below the low of the OB candle. Never inside the OB range, because price can sweep the zone partially before reacting. Typical buffer is 5-15 pips in Forex or 2-5 ticks in indices/futures, depending on the asset's volatility.
On a bearish OB, the logic is mirrored: the SL goes above the high of the OB candle with the same buffer.
Additional invalidation criterion: if price closes a candle below the Mean Threshold (50% of the OB), many traders consider the OB mitigated and prefer to close the trade manually before the full SL triggers. This reduces the loss per failed trade.
Take Profit: hierarchical target system
The 3 TP levels on a bullish OB
Take profit isn't a single level. SMC applies a three-level scaled system, allowing you to lock in profit progressively while the rest of the trade runs toward more ambitious targets.
- TP1 — Next relevant high or nearby swing high. It's the initial target, usually gives R:R of 1:1 to 1:1.5. Close 30%-50% of the position here.
- TP2 — Fill the next unmitigated FVG or Imbalance in the trade direction. Typical R:R 1:2 to 1:3. Close another 30%-40% of the position. When this level is reached, it's recommended to move the SL to breakeven.
- TP3 — Major external liquidity: PDH (Previous Day High), weekly high or relevant equal highs. It's the trade's ambitious target, with R:R 1:3 to 1:5+. The remaining position runs to here with a trailing stop.
Draw on Liquidity (DOL)
A key ICT concept: before entering, identify the Draw on Liquidity — the most obvious piece of liquidity on the chart that the market "wants to reach". It's usually equal highs/lows, a daily high/low or a very visible zone of accumulated stops. That external liquidity is your final TP and defines the natural direction of the trade. If there's no clear DOL above, the long probably isn't worth taking.
SVG: Bullish Order Block
Order Blocks by quality
Not all Order Blocks are equal. The quality of an OB depends on several factors:
| Factor | Low quality OB | High quality OB |
|---|---|---|
| Displacement | Slow, lacks force | Powerful candle, large body |
| BOS | Only touches the high | Breaks with body and continues |
| Macro context | Counter-trend on higher TF | Aligned with higher TF |
| Killzone | Outside session | London or NY Open |
| Liquidity context | No prior sweep | After a liquidity sweep |
Pro tip: Learn to discard low-quality Order Blocks more than to look for many high-quality ones. A disciplined SMC trader can spend days without taking a trade because no OB meeting all criteria appears. That's not inactivity: it's plan execution. Overtrading mediocre OBs is the main cause of failure in SMC.
Breaker Blocks and Mitigation Blocks
Breaker Blocks and Mitigation Blocks are two advanced SMC concepts derived directly from the Order Block. They represent two ways an OB can evolve when the original setup fails.
Breaker Block: an invalidated Order Block that flips polarity
Breaker Block — Precise definition
A Breaker Block is an Order Block that has failed after a liquidity sweep. The specific sequence is: (1) there is a previous high or low with accumulated liquidity, (2) price exceeds that extreme (liquidity sweep), (3) it fails to continue and reverses, (4) it crosses through the Order Block in the opposite direction. When retested from the opposite side, that invalidated OB works opposite to its original function (inverted polarity).
- • Bullish Breaker Block: a bearish Order Block that fails after price has swept a previous low. Price reverses upward and crosses through the bearish OB. On retest from above, the OB acts as support → LONG entry.
- • Bearish Breaker Block: a bullish Order Block that fails after price has swept a previous high. Price reverses downward and crosses through the bullish OB. On retest from below, the OB acts as resistance → SHORT entry.
The prior liquidity sweep is the defining characteristic of the Breaker and what distinguishes it from the Mitigation Block. The complete sequence is: price harvests breakout stops (sweep), continues briefly, and then reverses with such force that it breaks the OB that was supposed to support the trend. Operators who entered on the breakout get trapped above (or below), and those who bought at the OB get trapped below the broken low. That double trap is what generates the powerful push in the opposite direction during the retest of the Breaker.
Bearish Breaker Block: a bullish OB that fails after sweeping liquidity
First price forms a previous high (a resistance). Then it forms the bullish Order Block, deploys the bullish displacement and, with the next sequence of candles, exceeds the previous high: that is the liquidity sweep (the stops of shorts placed above the high have been harvested). Price should have continued upward, but instead it reverses and crosses the bullish OB downward. The OB is invalidated and, on retest from below, acts as resistance — SHORT entry.
How to trade a Breaker Block
Start from a well-identified Order Block
Look for a bullish or bearish OB that has been marked on the analysis timeframe. It must meet the three classic OB conditions (last opposing candle + displacement + BOS).
Watch if the OB fails (price crosses through it)
Instead of respecting the OB on retest, price breaks it in the opposite direction with a displacement candle. That invalidates the original OB and turns it into a Breaker candidate.
Confirm the structure shift after the break
A BOS must occur in the direction of the break to confirm the change is real. Without BOS, the break may just be a temporary sweep.
Wait for the retest of the Breaker from the opposite side
Price usually returns to test the same OB zone but from the contrary direction. In a bullish OB broken downward, price rises and retests the zone from below.
Enter with confirmation in the direction of the BOS
With a confirmation candle (rejection) on the retest, enter in the direction of the break: SHORT if the bullish OB failed (Bearish Breaker), LONG if the bearish OB failed (Bullish Breaker). Stop on the other side of the Breaker (above the top in Bearish, below the bottom in Bullish). TP at the next external liquidity.
Mitigation Block: the OB fails WITHOUT sweeping liquidity
Mitigation Block — Precise definition
A Mitigation Block is, like the Breaker, an Order Block that has failed. The difference is in what happens before the failure: in a Mitigation Block, price fails to make a new high or low (failure swing) before reversing and breaking the OB. That is, the trend loses momentum prematurely: price tries to continue, falls short without sweeping liquidity from the previous extreme, and reverses through the OB.
- • Bullish Mitigation Block: in a downtrend, price fails to make a new low (failure swing), reverses upward and crosses through a previous bearish OB. On retest from above, that broken OB acts as support → LONG entry.
- • Bearish Mitigation Block: in an uptrend, price fails to make a new high, reverses downward and crosses through a previous bullish OB. On retest from below, it acts as resistance → SHORT entry.
The name "mitigation" comes from the fact that institutionals with pending orders in that OB use the retest to mitigate their positions (close at breakeven or with minimal loss), reinforcing the reversal.
The 3 variants side by side — when to use each
It's crucial not to confuse them. Everything depends on what price does relative to the OB and the previous extreme:
- Order Block (continuation): price reaches the OB, respects it and bounces. The trend continues and creates a new extreme.
- Mitigation Block (reversal by exhaustion): price doesn't reach the previous extreme (failure swing, the trend fails to extend) and reverses through a previous OB. No liquidity sweep.
- Breaker Block (reversal after sweep): price does reach the previous extreme (sweeps liquidity) but fails to continue and reverses through a previous OB. With liquidity sweep.
In summary: OB → the trend continues. Mitigation → the trend dies before sweeping extremes. Breaker → the trend dies after sweeping extremes.
Order Block vs Breaker vs Mitigation — Comparison Table
| Characteristic | Order Block | Breaker Block | Mitigation Block |
|---|---|---|---|
| Structure | Holds; starts the trend | Fails after liquidity sweep | Fails without liquidity sweep |
| Liquidity | Creates new high/low | Sweeps previous high/low | No liquidity sweep |
| Market scene | Initial impulse | Strong reversal / regime change | Loss of momentum |
| Location | Start of the trend | After a liquidity sweep | In a failed swing |
Fair Value Gaps (FVG) and Imbalances
Fair Value Gaps (FVG), also called Imbalances or Inefficiencies, are the second most used SMC concept after Order Blocks. They represent price gaps where the market didn't trade fairly, and price tends to come back to "fill them" before continuing.
Technical definition of the FVG
FVG — Definition
A Fair Value Gap is formed when, in a sequence of three consecutive candles, the wick of the first candle does not overlap with the wick of the third candle. The space between the high of the first candle and the low of the third (in a bullish FVG) is the fair value gap. This gap is a market inefficiency that tends to be filled.
Bullish FVG vs Bearish FVG
- Bullish FVG: the low of candle 3 is above the high of candle 1, leaving a gap. Price usually returns to fill the gap from above.
- Bearish FVG: the high of candle 3 is below the low of candle 1, leaving a gap. Price usually returns to fill the gap from below.
The color of candles 1 and 3 doesn't matter
The only thing that defines an FVG is the position of the wicks: that the low of C3 stays above the high of C1 (bullish) or vice versa (bearish). Candles 1 and 3 can be bullish, bearish or dojis — their direction is irrelevant. The key is that C2 must be a displacement candle (large body) in the FVG direction: that institutional force is what creates the gap and makes it tradable.
How to trade an FVG
Identify the FVG after a BOS or CHoCH
Isolated FVGs without context are noise. FVGs that form after a structural break are tradable.
Mark the gap range
High of candle 1 to low of candle 3 (in bullish). It's your entry zone.
Wait for the retest
Price usually returns at least to 50% of the FVG (CE concept — Consequent Encroachment by ICT) before continuing.
Enter on the reaction
When you see rejection inside the FVG (confirmation candle), take the entry in the direction of the previous BOS/CHoCH.
Consequent Encroachment (CE): ICT calls "CE" the 50% of the FVG. It's the point where the cleanest reaction usually happens. Many advanced SMC traders place their entry exactly at the CE instead of waiting to touch the FVG extreme, sacrificing some price for better execution probability.
Advanced FVG types
BPR (Balanced Price Range): when a bullish FVG and a bearish FVG overlap in the same zone. It's a double-confluence area, highly respected.
Volume Imbalance (VI): when the open of a candle doesn't match the close of the previous one (more common in assets with limited trading hours).
Liquidity Void: a very large FVG, typically following news, that acts as a magnet over the medium term.

The Wyckoff Methodology in Depth
If you want to understand the framework from which all SMC concepts derive — including the volume analysis SMC omits — this best-selling book gives you the tools most SMC traders never learn.
View bookLiquidity: BSL, SSL, Internal and External Range
Liquidity is probably the most important SMC concept, even more so than Order Blocks. The whole SMC mechanic — why sweeps appear, why Order Blocks work, why price moves in certain directions — is explained by the search for institutional liquidity.
BSL (Buy-Side Liquidity) and SSL (Sell-Side Liquidity)
BSL and SSL — The two basic liquidity sources
- • Buy-Side Liquidity (BSL): buy stops from short traders (stop-losses that, when triggered, execute as buy orders), accumulated above relevant highs. Price rises to "harvest" that liquidity.
- • Sell-Side Liquidity (SSL): sell stops from long traders (stop-losses that, when triggered, execute as sell orders), accumulated below relevant lows. Price drops to "harvest" that liquidity.
Large operators need counterparties to execute their large positions. A triggered stop-loss is, from the opposite point of view, a market order that provides liquidity. That's why price tends to visit zones rich in stops before the real directional move.
External Range Liquidity vs Internal Range Liquidity
| Type | Where it is | What it contains |
|---|---|---|
| External Range Liquidity (ERL) | Outside the current range (external highs/lows) | Breakout stops, equal highs/lows, daily/weekly highs |
| Internal Range Liquidity (IRL) | Inside the current range | FVGs (inefficiencies) and Order Blocks — zones the IPDA algorithm tends to rebalance |
Key nuance — what IRL is according to strict ICT: The IRL (Internal Range Liquidity) in ICT's original definition refers specifically to inefficiencies (FVGs) and Order Blocks within the range, not to internal swing highs/lows. Even though every internal swing has its own BSL/SSL (as we saw in the previous chart), what the IPDA algorithm seeks to rebalance before projecting toward ERL are the inefficiencies — the value gaps that were left untraded.
Key pattern ERL → IRL → ERL: The classic institutional behavior SMC identifies is: price captures external liquidity (sweeps a previous high), retraces to mitigate internal liquidity (an OB or FVG), and from there projects toward the next external liquidity on the opposite side. If you see this complete cycle on your chart, you're watching the SMC mechanic working exactly as ICT describes it.
Specific liquidity types
- Equal Highs / Equal Lows (EQH / EQL): double or triple highs/lows at exactly the same level. They concentrate stops like magnets. They will almost always be swept.
- Relative Equal Highs/Lows (REH / REL): almost identical levels but not exactly equal (minimal separation). In practice they work the same as EQH/EQL because stops cluster in the same zone.
- Trendline Liquidity: stops below a bullish trendline or above a bearish one. The obvious trend drawing attracts liquidity because all technical traders place stops in reference to that line.
- Session Highs/Lows: highs and lows of the sessions (Asia, London, NY). Key piece of Power of 3 (AMD — Accumulation, Manipulation, Distribution).
- Daily / Weekly / Monthly Highs & Lows: high-timeframe liquidity. They are the most powerful magnets on the chart.
- Previous Day / Week / Month High & Low (PDH/PDL/PWH/PWL/PMH/PML): constant institutional references, act as a natural Draw on Liquidity.
Inducement: the bait before the setup
Inducement (IDM) — Key concept
An Inducement (IDM) is a piece of intermediate liquidity — usually a minor swing low or high — that appears just before the real POI (high-timeframe OB or FVG). Institutionals need that liquidity to complete their orders, so price first sweeps the inducement and then taps the POI. It's the classic trap that takes out novices before the real move.
Step by step: how the trap works (bullish setup)
You have a bullish OB marked below
You identify a bullish Order Block (demand zone) on a high timeframe. It's your POI — you expect price to reach it and reverse upward.
Price retraces toward the OB
The pullback from highs begins. During the descent, price forms minor swings (it doesn't drop in a straight line).
The Inducement forms
The last minor swing low before reaching the OB stays as an apparent "higher low". That swing low is the Inducement. Visually, it looks like a valid support zone.
The novice enters here
An inexperienced trader sees that higher low and buys thinking it's the bottom. They place their stop-loss just BELOW the inducement (where liquidity accumulates). That's where the sell stops pool forms.
Sweep of the inducement (the trap)
Price drops a little more and breaks the inducement. The novice's stops trigger as sell orders — that's the liquidity institutionals needed. The novice exits the trade with a loss.
Tap on the real OB
Once liquidity is captured, price continues descending until it touches the real OB. Now there are active institutional orders waiting at that POI.
Real reversal
From the OB, price reverses upward with force. The advanced SMC trader — who waited for the inducement sweep before entering — captures the full move.
Draw on Liquidity (DOL): the price magnet
The DOL (Draw on Liquidity) is the most evident piece of liquidity on the chart — the zone that acts as a magnet and dictates the natural direction of price. In practice it is always high-timeframe ERL: PDH/PDL (previous day high/low), weekly equal highs, monthly highs/lows, etc. The more obvious that liquidity (the more traders with stops there), the stronger it works as DOL.
Practical hierarchy of an SMC trade:
- • Your final TP = the DOL (the external liquidity price wants to harvest)
- • Your entry zone = the next IRL level on the way (FVG or OB)
- • Intermediate obstacles = inducements price will sweep before reaching the DOL
If you don't identify a clear DOL in the trade direction, it's probably not worth taking: there's no "fuel" (target liquidity) for the move to have any range.
PD Arrays: Premium, Discount and Optimal Trade Entry
PD Arrays (Premium/Discount Arrays) are one of ICT's most sophisticated frameworks and many "mainstream" SMC tutorials skip them due to complexity. However, they are the tool that distinguishes the SMC operator who knows where to enter from the one who only knows what to enter.
What is a PD Array?
PD Array — Premium and Discount Array
A PD Array, in ICT's original terminology, is a specific institutional pattern (Order Block, FVG, Breaker, Mitigation Block, Liquidity Void, Old High/Low, Rejection Block) that operates within a dealing range divided in two halves: Premium (upper half, expensive price) and Discount (lower half, cheap price), separated by the Equilibrium (exact 50%). An SMC trader buys only PD Arrays in Discount and sells only PD Arrays in Premium.
The dealing range is typically defined between the last relevant bullish and bearish CHoCH, or between the last confirmed swing high and swing low on the analysis timeframe. The 50% (equilibrium) is drawn over that range and on each half you look for PD Arrays (OB, FVG, Breaker...) that justify the entry.
Important nuance about the term
Most "mainstream" SMC tutorials use PD Array as a synonym for "splitting the range into premium and discount". Technically that's incorrect: the PD Array is the pattern (OB, FVG, Breaker, etc.); premium and discount are the zones where those patterns are considered tradable. Understanding this distinction lets you use the terminology with precision and sets you apart from 90% of SMC traders.
The zones: Premium, Discount and Equilibrium
- Premium Zone (Overpriced): above 50% of the range. Supply zone. Only look for bearish PD Arrays (Bearish OB, Bearish FVG, Bearish Breaker) for shorts.
- Discount Zone (Underpriced): below 50% of the range. Demand zone. Only look for bullish PD Arrays (Bullish OB, Bullish FVG, Bullish Breaker) for longs.
- Equilibrium (50% of the range): reference level. Above = premium; below = discount. Entering at equilibrium without additional confluence is trading fair price — without edge.
- Operational rule: never buy in premium or sell in discount. This alone improves the risk/reward asymmetry, although it doesn't guarantee a higher hit rate.
Dealing Range split into Premium/Discount with OTE
How to read the chart: 1. Wait for a bullish impulse that breaks the previous high (confirmed BOS). 2. Draw Fibonacci from Swing Low (100%) to Swing High (0%). 3. Look for OB or FVG within the OTE 62-79%. 4. Entry at 70.5% with stop below the OB.
Optimal Trade Entry (OTE): the ICT Fibonacci
OTE — Optimal Trade Entry
The OTE is the optimal entry zone within the Discount Zone (for longs) or Premium Zone (for shorts), defined by the Fibonacci levels 62% – 79% of the retrace of the last impulse. The midpoint, 70.5%, is considered the "sweet spot" by ICT, the level where confluence with OB/FVG produces the highest-probability setups.
The OTE is always drawn over the last directional impulse confirmed with BOS, not over the full dealing range. After a bullish impulse with BOS, draw Fibonacci from the impulse low (0%) to the high (100%); the 62%-79% retracement zone is the OTE where you look for long entries. On a bearish impulse it's drawn the other way around, and the 62%-79% OTE is used to look for shorts.
Identify the impulse with BOS
There must be a clear directional move with structural break.
Draw the Fibonacci over that impulse
From swing low to swing high (bullish) or from swing high to swing low (bearish).
Mark the 62% - 79% zone as OTE
It's your maximum probability entry area.
Look for confluence with OB or FVG
The best OTE is the one that coincides with an Order Block or Fair Value Gap inside the zone.
Enter at 70.5% with confirmation
If there's confluence with OB/FVG at 70.5%, that's the optimal entry point.
IPDA (Interbank Price Delivery Algorithm)
IPDA — Controversial concept
IPDA is ICT's theory that price isn't moved by human traders but by an interbank algorithm that delivers price between liquidity pools. According to ICT, the IPDA looks at liquidity in 20, 40 and 60 day ranges to decide where to move price. It's the most controversial concept in the entire ICT methodology: no market participant has confirmed its existence, and there's no public evidence. However, operationally, treating the market "as if" the IPDA existed leads you to pay attention to 20/40/60 day liquidity, which empirically works.
Power of 3 (AMD) and Daily Profile
The Power of 3 (PO3) is ICT's framework that describes how a typical institutional trading day develops in three consecutive phases: Accumulation → Manipulation → Distribution (AMD). It's the recurrent pattern that lets you anticipate the real direction of the day before it unfolds.
The three phases of the institutional day
Accumulation — Asia Session (19:00-02:00 NY)
Low volume and narrow range. Institutions accumulate positions discreetly during the lowest activity session. This Asian range becomes the liquidity pool that will be swept later.
Manipulation — London Killzone (02:00-05:00 NY)
Sweep of one of the Asian range extremes to harvest liquidity. Triggers stops of traders who naively traded the range. The sweep direction is typically the OPPOSITE of the day's real direction.
Distribution — NY Killzone (07:00-10:00 NY forex / 09:30-11:00 indices)
The real directional move of the day. Price moves in the direction institutions wanted from the start, leveraging the liquidity harvested in the manipulation. This is where the cleanest move is captured.
Practical implication: Most days with clean directional movement start between 02:00 and 05:00 (NY time), coinciding with the London Killzone. If you're trading the Asian session looking for direction, you're trading the wrong phase: Asia is accumulation (range), not trend.
Conceptual note
The PO3 AMD scheme is not exclusively an ICT invention: it's an intraday expression of the accumulative/distributive processes that Richard Wyckoff already described almost a century ago at the scale of days and weeks. If you want to dive deeper into the AMD cycle applied to individual candles and short ranges, read the complete CRT (Candle Range Theory) guide →.
Full detail of each killzone, with NY and CET hours, is in the next section.
What are the ICT Killzones?
Killzones are the time windows where institutional activity is at its peak. Outside these hours, SMC setups lose reliability. It's one of the principles most overlooked by novice SMC traders, who trade at any time and wonder why their entries fail.
The 4 main killzones (NY time)
| Killzone | NY time | CET time (Madrid) | Characteristics |
|---|---|---|---|
| Asian Killzone | 19:00-22:00 | 01:00-04:00 | Narrow range, ideal for JPY, AUD, NZD |
| London Killzone | 02:00-05:00 | 08:00-11:00 | Maximum direction, EUR and GBP |
| NY Killzone | 07:00-10:00 (FX) / 08:30-11:00 (indices) | 13:00-16:00 / 14:30-17:00 | Maximum global volume, USD, US indices |
| London Close | 10:00-12:00 | 16:00-18:00 | Reversal of the day's bias, second opportunity |
What to do in each killzone
- Asia: identify the range and mark its extremes. It's information, not direct operations for most.
- London: look for manipulation of the Asian range followed by SMC setup in the real direction.
- NY Open: continuation of London bias + new setups in US assets (indices, USD).
- London Close / NY PM: reversals, second opportunities, or end of session.
- Outside killzones: DO NOT take new setups. Only manage open trades.
Empirical observation: The London Killzone concentrates a noticeably high proportion of the day's directional move in major Forex pairs. There are no public academic studies quantifying this percentage, but the operational consensus among SMC traders is that the first hour of London (03:00-04:00 NY) is the window with the best activity-to-noise ratio. Many professional traders trade exclusively the first two hours of London and nothing else.
Train your killzones in simulation
A killzone lasts one or two hours a day, and learning to trade it takes a lot of repetitions. With NinjaTrader's simulator you can practice your entries in the London and New York sessions on market data without risking capital. The platform is free for charting, backtesting and simulation.
Affiliate link · paid partnership with NinjaTrader · #ad #NinjaTraderPartner
Bullish SMC Setup Step by Step
Let's see a complete bullish SMC setup integrating all the previous concepts: structure, liquidity, Order Block, FVG, PD Array, killzone. This is the complete framework a professional SMC trader uses.
The 7 steps of a bullish SMC setup
Bullish macro context (H4/D1)
Verify that the high-timeframe bias is bullish: sequence of higher highs and higher lows. Without favorable macro context, there's no setup.
Identify external liquidity taken
Within the bullish macro bias, price is in a bearish pullback on a low TF. Look for a recent sweep of a relevant low (PDL, SSL, equal lows) at the end of that pullback. It's the liquidity harvest that precedes the resumption of the bullish move.
Wait for the bullish CHoCH on H1/M15
After the sweep, look for the first upward break of the last lower high of the pullback. This confirms the change of character and the resumption of the bullish macro. If the break is with a displacement candle, it's an MSS (more reliable).
Identify the Order Block of the CHoCH
The last bearish candle before the impulse that caused the CHoCH. That's your entry OB.
Verify the OTE (62%-79%)
The OB must coincide with or be close to the 70.5% Fibonacci retracement level of the bullish impulse that caused the CHoCH. OB + OTE confluence is key.
Confirm active killzone
Ideally, the entry occurs during London Killzone or NY Killzone. Setups outside killzones have worse statistics.
Entry, stop and target
Entry at the OB after a bullish confirmation candle. Stop below the OB low (or the swing low of the pullback) with a small buffer matching the asset's ATR. Target: next relevant external liquidity (PDH, daily high, BSL).
Complete bullish setup with all confluences
Confluence rule: The best SMC setups have at least 4 aligned confluences. In the example above we count: (1) SSL sweep, (2) bullish displacement, (3) bullish CHoCH, (4) valid OB, (5) FVG in the zone, (6) OTE 70.5%. Six confluences = A+ setup. With fewer than 4 confluences, discard the setup and wait for a better one.
Bearish SMC Setup Step by Step
The bearish setup is the mirror image of the bullish. Directions change but principles are identical.
The 7 steps of a bearish SMC setup
Bearish macro context (H4/D1)
Sequence of lower highs and lower lows on high timeframe. Without confirmed bearish macro bias, no setup.
Recent BSL sweep
Within the bearish macro, price is in a bullish pullback on a low TF. Price must have harvested liquidity above (PDH, equal highs, relevant highs) at the end of that pullback.
Bearish CHoCH on H1/M15
First downward break of the last higher low of the bullish pullback, after the BSL sweep. Confirms the change of character and the resumption of the bearish macro. If the break is with displacement, it's an MSS.
Identify the bearish OB
Last bullish candle before the bearish impulse that caused the CHoCH.
Verify OTE (62%-79%) of the impulse
The OB must coincide with the Fibonacci retracement of the bearish impulse. 70.5% sweet spot.
Active killzone
London Killzone or NY Killzone. The London Close Killzone usually gives bearish reversals of the AM bias.
Execution
Entry at the OB with a bearish confirmation candle. Stop above the OB high (or swing high of the pullback) with a small buffer matching the asset's ATR. Target: next lower external liquidity (PDL, SSL).
Typical bearish setup mistakes: (1) Confusing pullback with CHoCH, (2) Entering before the BSL sweep (the sweep is a REQUIREMENT, not optional), (3) Ignoring the context that the broader market is systemically bullish long-term in indices (shorts are statistically more difficult than longs in SPX, NAS).
Complete bearish setup with all confluences
Confluence rule (bearish): Identical logic to bullish: the best bearish setups have at least 4 aligned confluences. In the example we count: (1) BSL sweep, (2) bearish displacement, (3) bearish CHoCH, (4) valid OB, (5) FVG in the zone, (6) OTE 70.5% in Premium. With fewer than 4 confluences, discard the setup and wait for a better one.
SMC is Modern Wyckoff
The connection between SMC and Wyckoff is not superficial. When Michael Huddleston built the ICT framework in the early 2010s, he took the fundamental principles of Wyckoff (accumulation, distribution, manipulation, stop sweeps, market phases) and rebranded them with modern names adapted to the digital Forex and crypto trader.
The same market, different label
Markets are fractal and institutionals have been operating the same way for a century: they accumulate where there's demand, distribute where there's supply, and harvest the liquidity of retailers. SMC puts modern names on the same phenomena. Understanding this equivalence gives you an edge: you decode any SMC content instantly and grasp the WHY behind the WHAT.
Wyckoff Spring = bearish Liquidity Sweep (SSL)
The Spring in Wyckoff is a temporary penetration of the support of an accumulation range that quickly reverses. In SMC it is exactly the same: a sweep of Sell-Side Liquidity that triggers stops of short traders and reverses upward.
| Wyckoff | SMC | Action |
|---|---|---|
| Accumulation range | Dealing Range / Consolidation | Consolidation |
| Range support | Sell-Side Liquidity (SSL) | Liquidity pool |
| Spring / Shakeout | Liquidity Sweep (SSL) | Stop sweep |
| Test of Spring | OB retest / Mitigation | Confirmation |
| Last Point of Support (LPS) | OTE 70.5% + OB in Discount | Entry zone |
| Sign of Strength (SOS) | Bullish BOS / MSS | Bullish initiative |
Wyckoff Upthrust = bullish Liquidity Sweep (BSL)
The Upthrust (UT/UTAD) is the mirror image: a temporary penetration of resistance in distribution. In SMC it's the sweep of Buy-Side Liquidity before the drop.
| Wyckoff | SMC | Action |
|---|---|---|
| Distribution range | Dealing Range / Consolidation | Consolidation |
| Range resistance | Buy-Side Liquidity (BSL) | Liquidity pool |
| Upthrust (UT/UTAD) | Liquidity Sweep (BSL) | Stop sweep |
| Last Point of Supply (LPSY) | OTE 70.5% + OB in Premium | Entry zone |
| Sign of Weakness (SOW) | Bearish BOS / MSS | Markdown |
What is the difference between Wyckoff and SMC?
You now have the complete SMC framework. Let's compare it side by side with Wyckoff to understand what each methodology shares, adds and loses.
Direct comparison
Both methodologies share the same underlying principles. The main difference: SMC contributes simplicity and timing for executing fast intraday trades, while Wyckoff contributes depth and context (volume, phases, target projection).
| Aspect | Wyckoff Method | Smart Money Concepts |
|---|---|---|
| Origin | Richard Wyckoff, 1910-1930 | Michael Huddleston / ICT, 2010s |
| Volume | Central and mandatory analysis | Not systematically included |
| Structure | Complete phases (A, B, C, D, E) with events | Systematized patterns (BOS, CHoCH, OB, FVG) |
| Target projection | Cause-and-effect (size of consolidation range) | Next liquidity pool |
| Timing | Independent (structural context) | Specific killzones (London, NY) |
| Ideal timeframe | Daily / Weekly (swing, positions) | Intraday M5-H1 (scalping, daytrading) |
| Learning | 6-12 months to master | 2-4 months for basic framework |
Main difference: Wyckoff gives you the structural roadmap (where you are in the market cycle and where it's going, with volume as a filter). SMC gives you tactical execution (where to enter precisely intraday and when). Neither is objectively better: the combination beats either alone.
How to combine Wyckoff and SMC
The real power comes from using both methodologies together: Wyckoff for strategic context, SMC for tactical execution. This way we solve the main limitation of each one.
The perfect combination
Use Wyckoff on higher timeframes (D1, H4) to identify market phase (accumulation, trend, distribution) and probable direction. Then use SMC on lower timeframes (M15, H1) to find precise entries aligned with the Wyckoff context.
The integration framework
Wyckoff analysis (D1/H4)
Accumulation, trend, distribution? Which phase (A, B, C, D, E)? Was there a recent Spring/Upthrust with confirmatory volume? This is your macro hypothesis.
SMC structural confirmation (H1)
Look for CHoCH or BOS aligned with the Wyckoff hypothesis. If H1 structure contradicts the macro context, don't execute.
POI identification (M15/M5)
Locate Order Blocks, FVGs or Breakers on low TF aligned with Wyckoff direction + H1 structure. Apply OTE 62-79% filter.
Timing: killzone + liquidity sweep
Execute within London or NY Killzone, after the liquidity sweep (SSL or BSL).
Dual management
Stop below the sweep swing (SMC). TP1 at next internal liquidity. TP2 ambitious at the opposite extreme of the Wyckoff structure.
Golden rule: Never look for SMC setups that contradict your Wyckoff analysis. If Wyckoff says "distribution in phase C", don't trade bullish Order Blocks no matter how perfect they look. The Wyckoff context always rules over the SMC signal.
The 5 Fatal Mistakes of the SMC Trader
I've analyzed dozens of accounts of SMC traders who can't be profitable despite knowing every concept. The problem is rarely technical: it's execution. These are the five mistakes that destroy SMC accounts, in order of frequency.
Mistake #1: Identifying Order Blocks without displacement or BOS
The problem: Marking any opposing candle as an "Order Block" without verifying the three conditions (last opposing candle + displacement + BOS). This leads to trading zones with no real institutional presence.
The solution: Mandatory checklist before marking an OB:
- Is there a displacement candle (large body)?
- Does the impulse break a structural swing (BOS)?
- Is this the last opposing candle before the impulse?
If any answer is "no", it's not a valid OB. Period.
Mistake #2: Trading against the higher timeframe context
The problem: Seeing a bullish OB on M15 and entering long without checking that H4/D1 is in accumulation or uptrend. A bullish OB in the middle of distribution has a drastically lower win rate.
The solution: Strict top-down protocol:
- Define D1 bias (bullish, bearish, range)
- Confirm H4 structure (higher highs and lows for bullish; lower highs and lows for bearish)
- Only look for setups on M15/M5 aligned with H4+D1
- If H4 contradicts D1, skip the day (don't trade in indecision)
Mistake #3: Ignoring killzones
The problem: Trading SMC at any time. Signals outside killzones have many more false positives because there's no institutional presence supporting the moves.
The solution: Limit yourself to the main windows:
- London Killzone: 02:00-05:00 NY
- NY Killzone: 07:00-10:00 NY forex / 09:30-11:00 NY indices
- London Close Killzone: 10:00-12:00 NY
Everything else: only manage open trades, don't open new ones.
Mistake #4: Lack of confirmation — entering on the touch
The problem: Entering at price on the first touch of the OB or FVG, without waiting for a confirmation candle. Price often penetrates the zone slightly before reacting, and entering on the touch takes you out at stop before the real move.
The solution: Two confirmation levels:
- Conservative: wait for a candle to close inside the OB with clear rejection (long wick against the opposite direction)
- Aggressive: pending orders at 50% of the OB (Consequent Encroachment) with stop below the extreme
Mistake #5: Overtrading after losses
The problem: After a loss, the temptation to "recover" leads to forcing setups that don't exist, lowering confluence quality and trading at the wrong times. It's the main destroyer of SMC accounts.
The solution: Hard non-negotiable rules:
- Maximum 2 trades per day
- Maximum 2 consecutive losses → stop for the day
- Maximum 5% weekly drawdown → stop for the week
- No exceptions, even if "you see the perfect setup"
Golden rule
If you regularly make more than one of these mistakes, stop live trading and go back to demo. Practice 2-3 weeks without making any of them. Only then return to live with minimum size. The problem is never the methodology: it's undisciplined execution.
The Psychology of the SMC Trader
SMC has psychological advantages over other methodologies (clear rules, defined setups, mechanical stops), but also specific challenges you should know about.
Why SMC helps psychologically
- Clear rules: the setup is or isn't, less room for doubt
- Defined setup: you know exactly what to look for (OB + BOS + FVG + OTE)
- Mechanical stop: the stop goes in a specific place (behind the sweep or the OB)
- Clear target: next external liquidity
- Killzones impose discipline: you don't trade at any time
Specific SMC psychological challenges
Challenge #1: FOMO of marginal setups
You'll see many OBs, many FVGs, many zones that "almost" qualify. The temptation to trade "just in case" is constant. The profitable SMC trader is the one who says "no" 9 out of 10 times.
Challenge #2: Confirmation bias
Once you have a bullish bias, you'll start seeing bullish OBs everywhere and ignoring bearish signals. This bias is especially strong in SMC because the concepts are visual and subjective.
Challenge #3: Revenge trading post-sweep
When a setup fails because of a sweep you thought was the good setup, the temptation to "trade the opposite" is strong. Resist. The inverted setup isn't automatically valid because the original failed.
Routine of the disciplined SMC trader
Pre-market (30 min before killzone)
Analyze D1 and H4. Define the day's bias. Identify external liquidity (PDH/PDL, equal highs/lows). Mark potential POI zones. All without opening a single order.
During active killzone
You actively monitor. Look for the manipulation (sweep). If it appears and meets all confluences, execute with the prepared order. If not, wait.
Post-session (30 min after)
Record trades (winners and losers) in a journal. Note the confluences you used, context, result. Review trades NOT taken: would they have been right? What was missing?
Weekly
Each Friday: review the 10-20 trades of the week. Look for patterns: which confluences worked best? Which killzone gives you the best results? Which asset? Adjust rules based on evidence.
"The market owes you nothing. Each trade is independent of the previous one. Your job is to execute your plan, not to make money on every individual trade."— Mark Douglas, Trading in the Zone
Key fact: Profitable SMC traders are not the ones who best identify the patterns. They are the ones who best avoid discipline mistakes. Technique gets you 20% of the way; psychology and disciplined execution get you the remaining 80%.
Legitimate Criticisms of SMC
It's honest to acknowledge the valid criticisms SMC receives within the trading community. Ignoring them does a disservice to your learning.
1. Rebranding of pre-existing concepts
Valid criticism
Much of SMC is price action repackaged with new terminology. Order Blocks = refined supply/demand zones. Liquidity Sweeps = stop hunts documented by Wyckoff (Spring/Upthrust) and Linda Raschke (Turtle Soup). The mitigation candle = classic break-of-structure pullback.
This doesn't invalidate SMC — systematization has value — but it does call into question the "trading revolution" narrative some educators sell.
2. Lack of scientific evidence about "manipulation"
SMC assumes the market is "manipulated" by institutions that "hunt" stops systematically. Although there is strong evidence that institutions seek liquidity, the term "manipulation" is legally debatable. Regulated markets have strict rules against real manipulation, and there are no academic studies supporting the IPDA theory or coordinated "interbank algorithms".
Wyckoff used the term "maneuvers", which is more precise and less conspiratorial.
3. The scavenger course industry
The hard truth
SMC has become a massive commercial product. Thousands of "educators" sell courses ranging from $500 to $5,000 promising unrealistic win rates. Many have less than 3 years of live experience. The CFTC RED list (suspicious operators list) is full of "smart money" brands that disappear after collecting annual subscriptions.
Warning signs of a fraudulent SMC educator:
- Promises win rates above 80%
- Doesn't show verified live accounts
- Avoids talking about losses or drawdown
- Sells "the latest thing" every 3 months (recurring courses without adding new value)
- Attacks any criticism as "envy"
4. Unnecessary and circular complexity
Part of the academic criticism of SMC is that its terminology hides simple mechanics under sophisticated jargon. When you break down an SMC concept to its essence, you often discover it's a classic concept (support/resistance, retest, failed breakout) with a new name.
Honest advice
If an SMC concept isn't clear after studying it, look it up in Wyckoff. 90% of the time you'll find the same concept explained with much more clarity and depth, without marketing terminology.
5. High subjectivity in identification
A valid criticism of SMC is the subjectivity in identification:
- What is the "correct" Order Block? Different traders see different OBs
- When is it BOS and when is it noise? Depends on which swing you consider structural
- How many pullback candles invalidate an FVG? No universal rule
- Which timeframe is "correct" for a setup? Depends on the trader
- Without 100% objective rules, automated backtesting is difficult
Wyckoff also has subjectivity, but the volume analysis adds an objective confirmation layer that SMC lacks. A spring with climactic volume is objectively more probable than without volume.
Limitations and Risk Management
SMC is a useful tool, but it's not perfect. Knowing its limitations lets you use it correctly.
When SMC fails most
Contexts where SMC has lower win rate
- • Wide ranging markets without trend: sweeps are noise, not real manipulation
- • Macro news days: NFP, FOMC, CPI alter normal institutional patterns
- • Asia session: low liquidity, M5 setups can be pure randomness
- • Simultaneous correlated assets: trading EUR/USD and GBP/USD at the same time doubles real risk
- • Without macro context: a "perfect" SMC setup against Wyckoff has much lower probability than with favorable context
Risk management for SMC
Since SMC can generate many signals, risk management is critical:
- Maximum risk per trade: 0.5% - 1% of capital
- Minimum R:R ratio: 1:2 (ideally 1:3 with high confluences)
- Maximum 2 active trades simultaneously
- Maximum 3 new trades per day
- Stop loss always behind the sweep/OB, never arbitrary
- Correlation: avoid 2 longs in EUR/USD + GBP/USD at the same time (it's a single hidden trade)
Sample position sizing
Capital: $10,000
Risk per trade: 1% = $100
Stop in pips: 20 pips
Value per pip: $100 / 20 pips = $5/pip
Position size: $5/pip in EUR/USD → 0.5 standard lots
Master rule: Risk management matters more than the strategy. A trader with mediocre SMC and rigid management beats a trader with perfect SMC and weak management. Always. No exceptions.
Conclusion: SMC as a Modern Wyckoff Dialect
By this point, you have the entire SMC framework laid out and its real relationship with Wyckoff. The remaining question is: what do I do with this?
My recommendation by trader profile
If you're starting:
- • Learn Wyckoff first (2-4 months)
- • Add SMC afterwards as a tactical layer (1-2 months)
- • Combine both with volume (Volume Profile)
- • Result: trader with structural edge over the SMC mass
If you already trade SMC with results:
- • Add Wyckoff as a macro filter (avoid counter-trend setups)
- • Incorporate volume analysis
- • Improve win rate by filtering more setups
If you already trade Wyckoff:
- • Learn SMC as a dialect (1 month)
- • It will give you modern vocabulary to consume intraday content
- • You won't replace your methodology, just add tools
The optimal learning path
Wyckoff fundamentals (months 1-3)
The 3 laws, the 4 phases, the main events (Spring, Upthrust, SOS, SOW, PS, SC, AR, ST). Philosophical foundation + market mechanics.
Volume analysis (months 3-4)
Effort vs result, absorption, climax volume. This sets you apart from 95% of SMC traders who ignore it.
SMC terminology (months 4-5)
Now that you understand the why, SMC terminology will feel intuitive. Order Blocks, FVG, BOS/CHoCH, OTE, killzones.
Integration and backtesting (months 5-6)
Develop your combined framework. Manual backtesting of 100+ trades. Adjust rules based on real results.
Volume Profile and refinement (month 6+)
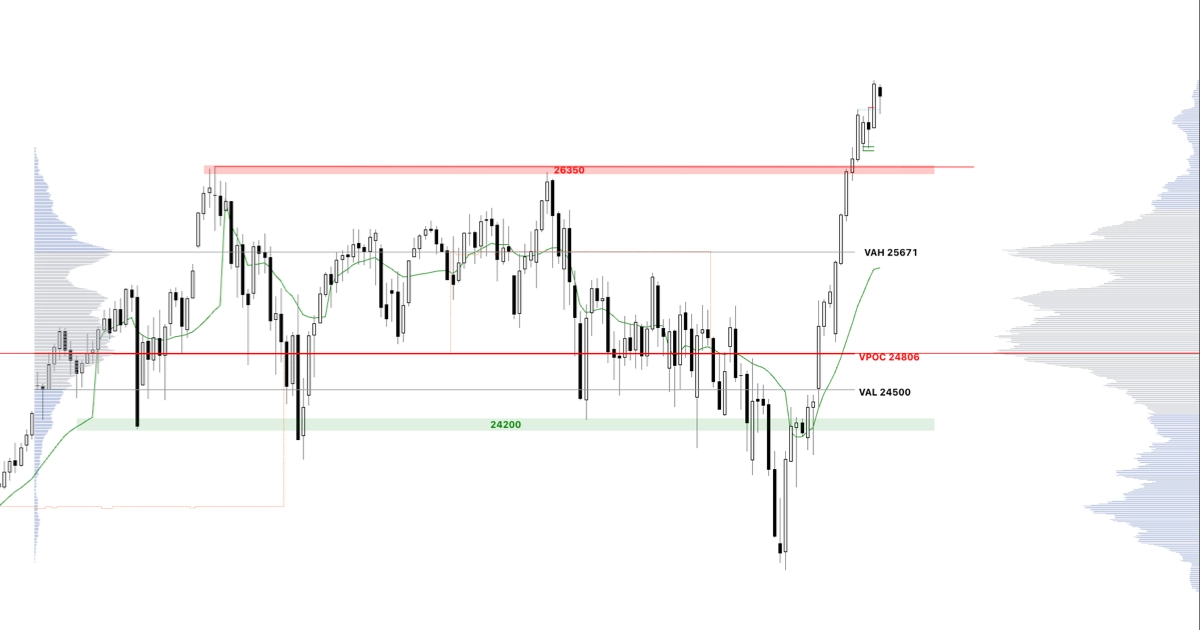
Add Volume Profile, VPOC, Value Area. Refine risk management. Optimize your edge over the average SMC trader.
Philosophical closing
My position as a trader and educator
SMC is not an enemy of Wyckoff. It is a modern dialect of the same language. There's nothing wrong with using SMC terminology if you understand the original principles. The problem is not SMC itself: it's the guru industry that sells SMC as "the latest thing" without acknowledging or teaching its historical roots, without including volume analysis, and promising unrealistic results.
Learn the original principles (Wyckoff), adopt the useful tools (SMC), and you'll trade with an edge over 95% of retail.
Take the next step
If you want to master the complete framework — deep Wyckoff, volume analysis, Volume Profile, and apply it with modern terminology — the Advanced Wyckoff + Volume Profile Course is the most complete program available. View the complete program →
Sources and bibliography
The following references support the data and historical citations mentioned throughout the article.
Original works and derivatives (evolutionary chain Wyckoff → ICT → SMC):
- • Wyckoff, R. D. (1931). The Richard D. Wyckoff Method of Trading and Investing in Stocks: A Course of Instruction in Stock Market Science and Technique. Wyckoff Associates. Available at archive.org.
- • Wyckoff, R. D. (1934). Tape Reading – The Day Trader's Bible. Magazine of Wall Street.
- • Williams, L. (1979). How I Made One Million Dollars… Last Year… Trading Commodities. Windsor Books.
- • Williams, L. (1999). Long-Term Secrets to Short-Term Trading. Wiley.
- • Raschke, L. B. & Connors, L. (1995). Street Smarts: High Probability Short-Term Trading Strategies. M. Gordon Publishing Group.
- • Huddleston, M. (Inner Circle Trader). Public educational material on YouTube: @InnerCircleTrader. 2010-present.
Academic works on the SMC premise:
- • Lo, A. W. & MacKinlay, A. C. (1999). A Non-Random Walk Down Wall Street. Princeton University Press. (Academic evidence of non-randomness in financial markets that supports the SMC premise.)
Academic resources on microstructure and institutional liquidity:
- • Harris, L. (2003). Trading and Exchanges: Market Microstructure for Practitioners. Oxford University Press.
- • O'Hara, M. (1995). Market Microstructure Theory. Blackwell Publishing.
My own Wyckoff analyses published on this site: