Spring/Shakeout: The Most Important Event in TRADING
The shakeout is the key event all Wyckoff traders wait for. No other event adds more strength to the analysis.

Ruben Villahermosa
Trader and educator
What is a Wyckoff Spring?
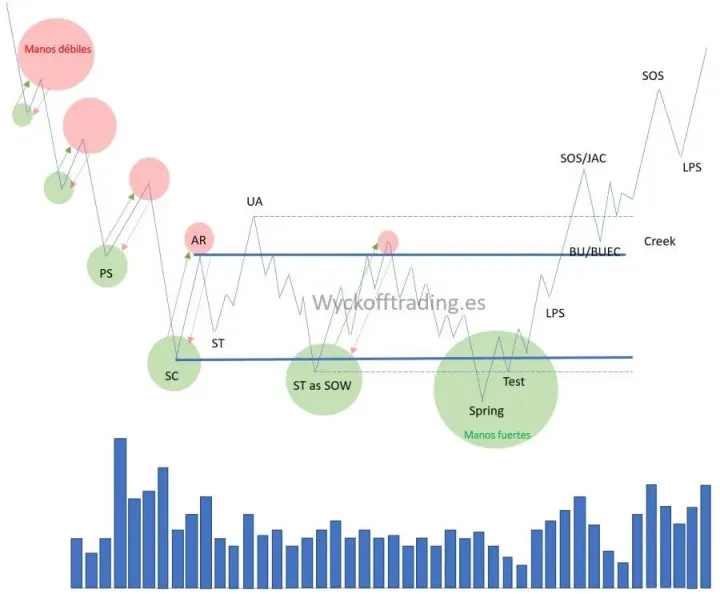
The Wyckoff Spring is a bearish shakeout that temporarily breaks the support of an accumulation range (Phase C) to trigger buyers' stop losses and attract sellers, whose orders large operators absorb before turning price upward. The Shakeout (Terminal Shakeout) is the same action with deeper penetration and high volume.
In this article
Article Summary
The Spring/Shakeout is the most important event in the Wyckoff methodology: a shakeout that temporarily breaks the support of an accumulation structure to capture liquidity (trigger Stop Losses and attract sellers) before turning upward. The Shakeout is more violent than the Spring. There are 3 types based on penetration depth (minor, moderate, major). The subsequent test should show low volume to confirm that supply has been exhausted. In distribution, the equivalent is the UTAD (UpThrust After Distribution).
Video in Spanish with English subtitles available

The Most Important Event
The shakeout is the key event all Wyckoff traders wait for. No other event adds more strength to the analysis, making it, from my perspective, the most important event that can occur in financial markets.
After a period in which large operators have built most of the position they desire, they use this behavior as a turning point to originate the trending movement that will take price out of the range.
For us to be watching for a potential shakeout, two actions must have occurred previously:
- 1 The stopping of the previous trending movement, whether with climactic volume or not.
- 2 The building of a significant cause. This is the development of Phase B, during which we deduce that professionals have been absorbing stock.
Zero-Sum Game
As we know, due to how financial markets work based on the law of supply and demand, for an order to be executed, it must be matched with another order whose intention is the opposite. This means that for a sell order (supply) to be executed, it must be matched with a buy order (demand) and vice versa.
This is very important to understand because in this event, as in the other two deception events (Preliminary Stop and Climax), all orders originating from uninformed operators or weak hands are being absorbed by well-informed operators or strong hands.
Critical Factor
The critical factor when analyzing this event is to determine the aggressiveness with which the key zone is being broken and how the market reacts immediately after this action.
The Behavior
The action is simple: it's a movement that breaks a previous liquidity zone (areas where a large number of pending orders will be located) that initially denotes intentionality toward the breakout direction but is actually another deception.
What happens is a false breakout where large operators will absorb all those pending orders to initiate the trending movement they expect.
The Search for Liquidity
This is how financial markets move: through the search for liquidity. If large operators couldn't find the counterparty they need to match their orders, the market would be impossible to move.
Therefore, they need to create the sensation that it's a genuine breakout movement to attract more operators and absorb all those orders.
If you look at any chart, regardless of market or timeframe, you'll see that for any significant trending movement, a shakeout has previously developed. It's necessary. That order crossing is the fuel they need to move.
Understanding this will elevate your trading several levels because you'll start being more alert to this possibility and over time you'll learn to profit from this behavior.
How the Shakeout Appears on the Chart
Normally shakeouts will present themselves in different forms:

Different ways the shakeout can appear
Single Candle
This is the commonly known hammer candle. It's a candle that penetrates the liquidity zone and returns practically the entire movement within that same candle, leaving a significant tail at its extreme.
These wicks denote a rejection of prices to continue moving in that direction. Aggressiveness has been found from operators who were waiting in the opposite direction to the breakout, and they have managed to at least temporarily take control of the market.
2 or More Candle Pattern
The essence of the action is exactly the same as for the single candle example. The only difference is that in this scenario, the behavior develops over a longer time period.
The fact that price takes more time before reversing and recovering the previously established breakout zone is a sign of lesser strength for the shakeout. In other words, the less time the turn takes, the more strength the shakeout will denote.
Minor Structure
In this scenario, price remains for a longer period in potential shakeout position.
Market control is not well defined, which is why a minor structure is needed that will ultimately act as a shakeout of the major structure. This is a clear example of the importance of context.
- In potential Spring position, we look for a minor accumulation structure that will generate the bullish turn.
- In potential Upthrust After Distribution position, we look for a minor distribution structure that will generate the bearish turn.
Functions of the Shakeout
This movement initiated by large operators has several functions
1 Expel Breakout Traders from the Market
Previously we presented them as greedy. They are those operators who see price make a new extreme and thinking it's a breakout that will continue, enter the market adding more pressure to prices.
It's important to note that not only manual traders guided by emotions will enter the market. Countless automated strategies programmed to trade breakout systems will generate entry signals at these levels. These robots may trigger other momentum strategies, which will add even more pressure to the movement.
2 Expel Fearful Traders from the Market
This group has been holding losing positions for a long period and their limit is very close. After seeing price move against them again and fearing to increase the loss even more, they finally decide to abandon their position.
3 Expel Smart Traders from the Market
They generally have good market reading and have correctly anticipated the price turn, but they were premature in their entry. They may have already sold on the climactic event or on some minor shakeout within the range. This unexpected final shakeout makes them abandon their position by triggering their protective stops.
4 Profit from the Maneuver
The professionals who unbalance the market and originate the breakout movement take advantage of the displacement caused by breakout trading and close their positions obtaining a profit from the difference.
Signs to Know if We're Facing a Potential Shakeout
The two elements to observe to try to determine a higher probability that we're facing a shakeout instead of an effective breakout are the following:
The Type of ST that Occurs in Phase B
- If we have previously identified a Secondary Test in the form of Upthrust Action (UA), this denotes greater strength to buyers and therefore in the zone of structure lows breakout we favor the Spring instead of the bearish breakout.
- If what price has left is a Secondary Test in the form of Sign of Weakness (ST as SOW), it denotes seller strength and in the zone of structure highs breakout we favor the Upthrust instead of the effective bullish breakout.
Price Behavior After the Breakout
- If after the breakout of the lower part of the structure the price fails to stay below and re-enters the range, it denotes strong buying entry and adds higher probability that the breakout is false and that a Spring is therefore developing.
- If after the resistance breakout the price fails to stay above the level, it denotes weakness and adds higher probability that the breakout is false and therefore an Upthrust is developing.

The Wyckoff Methodology in Depth
The best-selling book on the Wyckoff Method. 325 pages that will teach you to identify institutional money footprints and trade alongside smart money.
Spring/Shakeout
The term Spring is an abbreviation of the word "Springboard".
This concept was introduced by Robert G. Evans, a distinguished student of Richard D. Wyckoff, and is a refinement of the original concept developed by Wyckoff, known as Terminal Shakeout. Wyckoff referred to this term as a position the market reaches during the development of an accumulation range in which price is positioned to leave it and start an upward movement.
Remember that an accumulation range is a phase of the market cycle (which is composed of accumulation, uptrend, distribution, and downtrend phases) in which large market operators perceive value in price (find it undervalued) and carry out a buying process with the intention of selling at higher prices and profiting from the difference.
The Spring event describes a bearish movement that breaks a previous support area and whose purpose is to carry out a transfer of shares from weak hands (potentially manipulable operators due to their lack of knowledge of how the market works and because they trade based on emotions) to strong hands (large operators).
Types of Spring
Three types are differentiated based on the degree of supply observed at the time of breakout
At the moment the support breakout occurs, we must remain very attentive and carefully observe price and volume behavior. If we're already in a buy position, depending on how price falls we'll decide whether to stay in the trade or exit immediately. If a strong bounce from the level with a slight volume increase is observed, it indicates the asset is developing technical strength.
#1 Spring #1 or Terminal Shakeout
Supply appears strongly (great selling interest). This is evidenced by a sudden volume increase and price range expansion that produce a large penetration of the support line.

In essence, the Spring and Terminal Shakeout are the same action: a bearish movement that breaks a previous support area. But there are differences between them, found in the intensity (volume) and reach of their development; while Spring is used to define shorter movements with slight or moderate volume; Terminal Shakeout is used to define movements with much deeper penetration and high volume.
Supply is in control of the situation. There is extreme weakness and price falls. For this type of Spring to be successful, a strong demand entry must occur that drives price back up with wide price ranges and relatively high volume.
A first indication that demand may be entering is if after penetration, volume remains high but price ranges begin to decrease. If demand doesn't appear, price will continue falling and will have to build a new accumulation area before a substantial upward movement can take place.
#2 Spring #2
A moderate penetration is observed as price breaks down with an increase in both volume and price ranges.

There is floating supply (operators willing to sell), but it's not as overwhelming as in Spring #1. That latent supply will need to be absorbed by professionals if they want to push price up, so we'll most likely see successive tests of that zone.
#3 Spring #3
There is supply exhaustion (lack of selling aggressiveness). This is evidenced by slight breakout reach, with decreasing volume and narrowing price ranges; suggesting a total lack of interest on the bearish side.

This is a very powerful Spring on which buy positions can be taken directly.
We can also find a final variant where the event develops within the range limits. This event denotes greater underlying strength, although professionals prefer the shakeout to occur beyond the range because it does a better job of cleaning out remaining supply from weak hands.
The Spring action is an important sign of strength since the fact of failing at the breakout provides us a greater degree of confidence when taking action afterward.
Video in Spanish with English subtitles available

The Ordinary Shakeout
The Spring and Terminal Shakeout are two similar events which occur during the development of an accumulation range. But there is another variant; the Ordinary Shakeout, which is defined as a strong bearish push without extensive prior preparation that occurs during the development of an uptrend (re-accumulation). This is the main difference: the location.
The Ordinary Shakeout is characterized by wide price ranges and volume increase. However, volume can be high, medium, or low.

Ordinary Shakeout during an uptrend
The Spring Test
Except for Spring #3, in the other variants the event needs to be tested since supply has been observed and a positive outcome is not guaranteed.
Caution
Be very cautious if the testing process has not occurred as it may take place at a future time.
For the test to be successful, it should develop with:
- Range narrowing
- Volume decrease
- It should stay above the Spring/Shakeout level
All this would indicate supply exhaustion and suggests that price is ready to initiate the upward movement with relative ease, representing a good buy signal.
If the test doesn't meet these characteristics, it's considered a poor quality test and suggests further testing later since a Spring with significant volume needs to be successfully tested before the upward movement can begin.
We must train ourselves to anticipate the possible outcome of the event and be prepared to take action for our benefit quickly and decisively.
Common Mistakes When Trading Springs
Even experienced traders make mistakes when identifying and trading Springs. Knowing these traps will help you avoid unnecessary losses:
1 Confusing a Spring with a Successful Bearish Breakout
After breaking support, price may initially pull back the wick somewhat, creating the illusion of a Spring. The key is to observe what happens during the next 3-5 bars. If price remains outside the accumulation range for more than 5 consecutive sessions, it's likely a genuine bearish breakout, not a Spring.
Consequence: You go long thinking it's a Spring when it's actually the start of a downtrend. Significant losses before accepting it wasn't a valid Spring. If the Spring shows significant volume (Spring #1 and #2), it will most likely require a test before confirming the turn.
2 Confusing Any Breakout with a Spring
Seeing a candle that breaks support and turns quickly, assuming it's a Spring without verifying the context. The Spring is only valid in Phase C of a clear accumulation structure.
Consequence: You trade a "false breakout" in the middle of a downtrend or in Phase A (without prior accumulation), and price continues falling because there was no accumulative structure.
3 Stop Loss Too Tight
Placing stop too close to the Spring low because "I don't want to risk much." Price may return to test the low before rising definitively.
Consequence: Your stop gets triggered during normal Spring testing and then it rises without you. You need to leave enough room below the low to survive additional liquidity tests.
4 Ignoring the Spring Volume
Focusing only on price action (breakout + quick turn) without analyzing volume. A Spring with very high volume has greater failure risk.
Consequence: You trade a "Spring" that's actually a genuine bearish breakout with massive institutional participation. The test shows more high volume and price continues falling.
5 Not Differentiating the 3 Types of Spring
Treating all Springs equally without analyzing penetration and volume. Spring #3 (penetration <1%, low volume) can be traded without test. Spring #1 (penetration >3%, high volume) requires mandatory test and more patience.
Consequence: You wait for an unnecessary test on Spring #3 and miss the optimal entry, or enter prematurely on Spring #1 without test and suffer significant drawdown during subsequent testing.
Golden rule to avoid mistakes:
If you have doubts about whether it's a valid Spring, wait for the test. It's preferable to miss part of the move waiting for confirmation than to risk your capital trading a false Spring in the middle of a downtrend.
Spring Validation Checklist
Before trading a Spring, verify it meets ALL these criteria. If even one fails, wait for more confirmation or discard the trade:
Prior Requirements (Context)
- Clear accumulation structure in Phase C: There must be prior Selling Climax, Automatic Rally, Secondary Test(s) and visible lateral range of at least 15-30 bars for the structure to have statistical relevance
- Prior Secondary Test with strength signal: Ideally Upthrust Action (UA) in Phase B, demonstrating that buyers are controlling the range
- Position in time: The Spring must occur after completing Phase B (after several Secondary Tests). A "premature" Spring in Phase A has high failure rate (60-70%)
Spring Event Characteristics
- Support penetration: Between 0.5% and 5% below established support level. Penetrations >7% suggest possible genuine breakout, not Spring
- Quick recovery: Price must close within accumulation range in 1-5 bars (depending on timeframe). If it remains outside range >5 sessions, probably NOT a Spring
- Spring volume: Spring #3 (<1% penetration) = low volume (40-70% of average). Spring #2 (1-3%) = moderate volume (80-150%). Spring #1 (>3%) = high volume (150-300%) requires mandatory test
Confirmation Through Test (if applicable)
- Reduced test volume: 40-60% lower than original Spring volume. If test shows volume >80% of Spring, suggests supply still present and more tests may come
- Range narrowing: Test candles should be 40-70% smaller than Spring range. Ideally smaller than the period's ATR (Average True Range)
- Test level: Price should stop 0.3-1% ABOVE Spring low. If it penetrates the low with close below, the Spring may be failing
Final validation rule:
If the Spring meets ALL criteria for context + event + test (when applicable), success probability is 75-85%. If it fails even one critical requirement (no prior accumulation structure, excessive volume without test, penetration >7%), failure rate increases to 50-70% and you should discard it.
UpThrust After Distribution (UTAD)
An Upthrust After Distribution is the bullish shakeout that occurs as a Phase C test event within distribution and redistribution ranges.

Upthrust After Distribution in a distribution range
It's an upward movement whose purpose is to test buyers' ability to push prices higher when reaching a key zone, such as the breakout of previous highs.
Theoretically it's an Upthrust (UT), but occurring in Phase C, it's called UTAD regardless of whether there were prior Upthrusts in Phase B because a prior distribution process has already taken place.
In this action the volume observed will be moderate or strong, evidencing the quantity of orders being crossed at that key zone.
The Upthrust After Distribution Test
Although it can occur, after the UTAD a Secondary Test doesn't always appear. This is due to the large amount of supply entering the market, which causes the immediate bearish movement in the form of Sign of Weakness.
As with the Spring, it's generally better for the test to occur. The fact that the test doesn't appear may mean missing an opportunity, but waiting for it to happen will help you avoid taking a possible bad short position on an action that's actually a genuine bullish breakout (JAC/MSOS).
In case there is a test, it should show less enthusiasm than seen on the UTAD. This is generally reflected by price stopping at a level below the UTAD and a reduction in price ranges and volume, indicating buyer exhaustion and confirming the distribution scenario. On the top of this rise, sell positions can be taken.
If the test doesn't stay below the level established by the UTAD high or volume is higher, doubt the shakeout even if price has been making lower highs. The sensible thing is to wait for some additional signal before selling (new shakeouts and successive successful tests).
Terminal Upthrust
It resembles the Terminal Shakeout. It has the same characteristics as a normal Upthrust but the reach of the action is generally more severe. Volume can be extremely high or the penetration unusually large. Even so, the result is the same. In a short period of time price re-enters the range, indicating strong bearish pressure.
Spring vs Shakeout vs Test vs UTAD
These are related events that are frequently confused. What sets them apart is where they appear within the structure, the aggressiveness with which the key zone is broken and how the market reacts immediately afterward.
| Event | Where it appears | What price does | Typical volume | What confirms it |
|---|---|---|---|---|
| Spring (#2 and #3) | Phase C of an accumulation range, at support | Breaks support with slight (#3) or moderate (#2) penetration and quickly re-enters the range | Decreasing in #3; increasing in #2 (floating supply is present) | #3 can be bought directly; #2 needs a successful test. Then, a Sign of Strength that takes price toward resistance |
| Terminal Shakeout (Spring #1) | Phase C of an accumulation range, at support | Deep penetration of support with price range expansion | High, with a sudden increase | A strong demand entry that drives price back into the range and a successful subsequent test |
| Ordinary Shakeout | During an uptrend (re-accumulation), without extensive prior preparation | Strong bearish push with wide price ranges | Increasing; it can be high, medium or low | Its location: that is what differentiates it from the Spring and the Terminal Shakeout |
| Spring test | After the Spring or Shakeout, in the area of the lows | Returns toward the shakeout level and stays above it | Lower than on the shakeout | Range narrowing and volume decrease: supply exhaustion and a good buy signal |
| UTAD (distribution counterpart) | Phase C of a distribution or redistribution range, at resistance | Breaks previous highs and re-enters the range | Moderate or strong | A test with a lower high than the UTAD and reduced range and volume, or an immediate Sign of Weakness (the test does not always appear) |
Volume ultimately determines the type of Spring and therefore also the entry strategy.
The Spring Analogy and the Composite Operator
"As in nature, things move violently to their place and calmly in their place..."
It seems Mr. Bacon understood the market very well. Price tends to move slowly in ranges and violently in trends.
A turning point takes place between supply and demand when apathy transforms into activity. During a quiet and boring market, the seeds of change are planted.
The genius of speculation is knowing when the calm ends. Timing is everything in trading.
Wyckoff taught that in the accumulation process the seed of change is planted. Accumulation is the cause that produces the subsequent effect.
When the Composite Operator has no more stock to absorb during accumulation, a turning point occurs, where there's no reason for prices to continue with that apathetic and boring dynamic. All shares are in strong hands and only much higher prices will induce these strong hands to dispose of their positions.
In effect, there's a shortage of shares available for purchase; and when this shortage meets a slight increase in demand, prices can move upward violently.
The genius of the Wyckoff method is recognizing accumulation when prices are apathetic and trendless. Then, wait for the moment when conditions suddenly change and take action to align with the Composite Operator's interests.
The Wyckoff operator is trained to see the subtle nuances of absorption in the seemingly harmless fluctuations within the range.
A Spring (shakeout) tests the lower extreme of the range by penetrating the support area making new lows. It's a bear trap. It encourages traders to go short and the public to abandon the market by disposing of their positions.
The Composite Operator will suspend buying at the previous low level to determine if new supply appears when price falls toward new lows. The important Spring question for the Composite Operator is: How much supply is there below the lows? If there is supply, price could fall further before the Composite Operator places a large buy order below.
This condition is referred to as Shakeout. A Shakeout will normally be accompanied by volume expansion. A volume spike indicates new supply is entering the market. Lower prices generally follow this volume expansion. A Shakeout (or Spring #1) is a failed Spring.
Spring #3 produces a slight break to new highs with modest volume. It can be bought immediately and doesn't require a test.
Spring #2 reaches greater distance in the support break and is accompanied by volume expansion, denoting supply is present below support. This Spring must be successfully tested with low volume.
Shakeouts rarely occur. It's a large support break with a massive volume increase. It's a bearish movement with practically no upward retracement. This is an example of why volume expansion on breakout should be respected. There's not much to tell you how much supply is below.
Volume ultimately determines the type of Spring and therefore also determines the entry strategy. If after the Selling Climax low break there's no active selling, the Composite Operator concludes supply is exhausted and will add to their position.
The Wyckoff operator will buy a low-volume Spring immediately and place the stop below the lowest price. This type of Spring is known as Spring #3.
The definitive action that a false bearish breakout is a Spring is by the price action that follows. After the Spring, a Sign of Strength (SOS) should be seen that takes price toward resistance (and makes a new minor high) with an increase in price range and volume denoting demand is active. Generally, the Spring action develops in the final phases of the accumulation range.
When price breaks range support, it's in position to be a potential Spring. If after reacting upward price doesn't reach resistance level, this upward movement wouldn't be a show of strength (SOS); and the support break would be an ST instead of a Spring.
High volumes at the range base need to be tested. This is because there's large supply below the support line. If there's a move toward the support line with low volume (the test) it indicates prior supply was absorbed. Low-volume Springs don't need to be tested as they indicate supply has ceased to be present.
The Spring also has a modern intraday equivalent: Candle Range Theory (CRT) applies the same liquidation+rejection logic to a single candle's high or low. If you trade lower timeframes, learning CRT lets you operationalize Spring logic on M15 to 4H setups.


Frequently Asked Questions about Spring/Shakeout
What is the Spring in the Wyckoff Method?
What is the difference between Spring and Shakeout?
What are the 3 types of Spring based on penetration?
How do you confirm a Spring is valid?
What is the UTAD (UpThrust After Distribution)?
Why does the Spring occur according to Wyckoff?
When to trade the Spring and when to wait?
What is the Ordinary Shakeout and how does it differ from the Spring?
The Wyckoff Methodology in Depth
The most comprehensive book on the Wyckoff Method. Learn to identify institutional footprints and trade alongside smart money with real examples.
References and bibliography
Wyckoff, R.D. (1931). The Richard D. Wyckoff Method of Trading and Investing in Stocks. Wyckoff Associates. Chapter on "Shakeouts and Tests" - original methodology on detecting institutional shakeouts.
Pruden, H.O. (2007). The Three Skills of Top Trading: Behavioral Systems Building, Pattern Recognition, and Mental State Management. Wiley. Analysis of Spring psychology and behavioral patterns.
Schroeder, B. (2011). Wyckoff: Tested over Time. Stocks & Commodities Magazine. Quantitative analysis of Spring success rates by type and confirmation patterns.
Villahermosa, R. (2019). The Wyckoff Methodology in Depth: How to Trade Financial Markets Logically. Amazon KDP. Systematic approach to Spring identification, classification by penetration levels, and test confirmation strategies.
Williams, T. (2005). Master the Markets. TradeGuider. Volume spread analysis applied to shakeout detection and institutional accumulation signals.
