Understanding how financial markets truly move is the first step to trading with an edge. This knowledge, based on the Wyckoff methodology, will allow you to correctly interpret price action and anticipate future movements.
Waves in Financial Markets
Stock investor Wyckoff and the early tape readers noticed that price movements do not develop in equal time periods, but rather in waves of different sizes. For this reason, they studied the relationship between bullish and bearish waves.
Nature of Movement
Price does not move between two points in a straight line; rather, it does so in a wave pattern. At first glance, these appear to be random movements, but they are not at all. Price moves up and down through fluctuations.
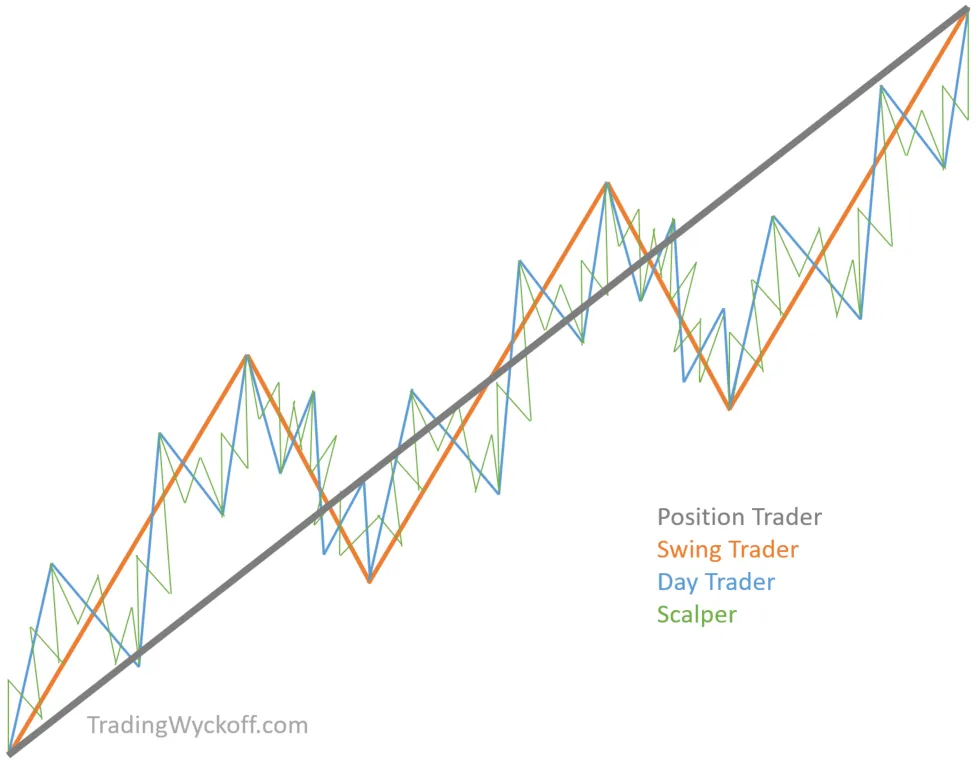
Waves have a fractal nature and interrelate with each other: smaller waves form part of intermediate waves, which in turn form part of larger waves.
Each bullish and bearish movement is composed of numerous smaller bullish and bearish waves. When one wave ends, another begins in the opposite direction. By studying and comparing the relationship between waves; their duration, speed, and range, we will be able to determine the nature of the trend.
Wave analysis provides a clear view of the relative changes between supply and demand and helps us judge the relative strength or weakness of buyers and sellers as the price movement progresses.
Through judicious wave analysis, the ability to determine the end of waves in one direction and the beginning in the opposite one will gradually develop.
The Price Cycle
In the basic market structure, only two types of formations exist:
- Trends: Can be bullish if heading upward, or bearish if heading downward
- Ranges: Can be accumulation if at the beginning of the cycle, or distribution if at the top of the cycle
As we have seen, price displacement during these phases occurs through waves.
Video in Spanish with English subtitles available

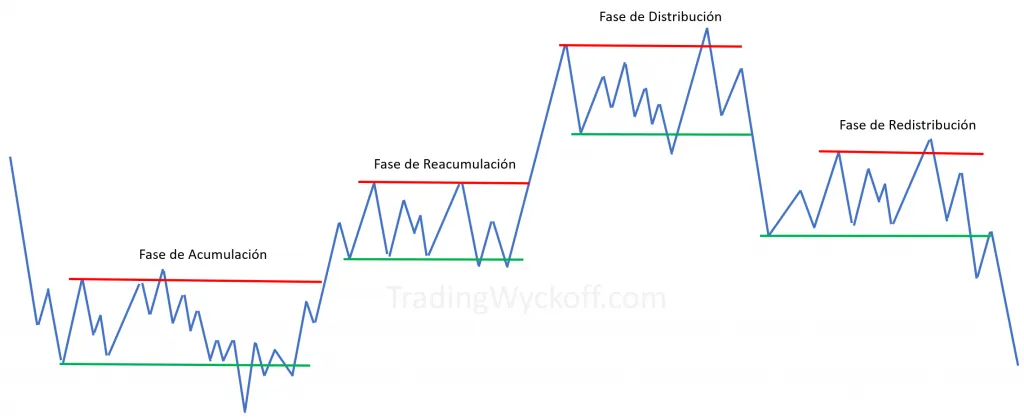
The Accumulation Phase
During the accumulation phase, professional operators buy all the stock available for sale in the market. Once they ensure through various maneuvers that there is no more floating supply remaining, they initiate the uptrend phase.
This trend phase is about the path of least resistance. Professionals have already verified that they will not encounter too much resistance (supply) that prevents price from reaching higher levels.
Key Concept: Path of Least Resistance
Until they verify that the path is clear (absence of sellers), they will not initiate the bullish movement; they will perform test maneuvers over and over again. If supply is overwhelming, the path of least resistance will be downward and the price at that point can only fall.
The Uptrend
During the uptrend, buyer demand is more aggressive than seller supply. In this stage, the participation of large but less-informed operators and the general public is added, whose demand causes the price to move upward.
The movement will continue until buyers and sellers consider that the price has reached an interesting level; buyers will see it as valuable to close their positions; and sellers will see it as valuable to start taking short positions.
The Distribution Phase
The market has entered the distribution phase. A market top is being formed and it is said that large operators are finishing distributing (selling) the stock they previously bought. The entry of the last greedy buyers occurs, as well as the entry of well-informed operators selling.
The Downtrend
When they verify that the path of least resistance is now downward, they initiate the downtrend phase. If they observe that demand is present and unwilling to leave, that resistance to lower prices will only leave one viable path: upward.
If it continues to rise after a pause, that structure will be identified as a reaccumulation phase. The same happens for the bearish case: if the price comes in a downtrend and a pause occurs before continuing the fall, that sideways movement will be identified as a redistribution phase.
During the downtrend, seller supply is more aggressive than buyer demand, so only lower prices can be expected.
The Advantage of Knowing the Cycle
Being able to determine in which phase of the price cycle the market is located constitutes a significant advantage.
Practical Rule
Knowing the general context helps you avoid entering on the wrong side of the market. This means that if the market is in a bullish phase after accumulation, you will avoid trading short, and if it is in a bearish phase after distribution, you will avoid trading long.
You may not know how to take advantage of the trend movement; but with this premise in mind, you will surely avoid having a loss by not trying to trade against the trend.
Market Positions
- Long position: When price is in accumulation or uptrend phases
- Short position: When in distribution or downtrend phases
- Neutral position: When there is no interest, no campaign has been carried out
A cycle is considered complete when all its stages are observed: accumulation, uptrend, distribution, and downtrend. These complete cycles occur in all timeframes.
Importance of Multiple Timeframes
It is important to consider all timeframes; because each one may be in different stages. It becomes necessary to contextualize the market from this point of view to perform a correct analysis.
Once you learn to correctly identify the four phases of price and assume a completely impartial point of view, away from news, rumors, opinions, and your own prejudices; taking advantage of your trading will be relatively easier.
Trends
Prices change and the waves resulting from these price changes generate trends. Price moves through a series of waves in the direction of the trend (impulses), which are separated by a series of waves in the opposite direction (retracements).
The trend is simply the line of least resistance since price moves from one point to another because it follows the path of least resistance; therefore, the trader's job is to identify the trend and trade in harmony with it.
When a market is rising and encounters resistance (selling), it either overcomes that resistance or the price will turn; the same happens when price is falling and encounters resistance; it either overcomes those buys or the price will turn. Those turning points are critical moments and provide excellent places to trade.
Types of Trends
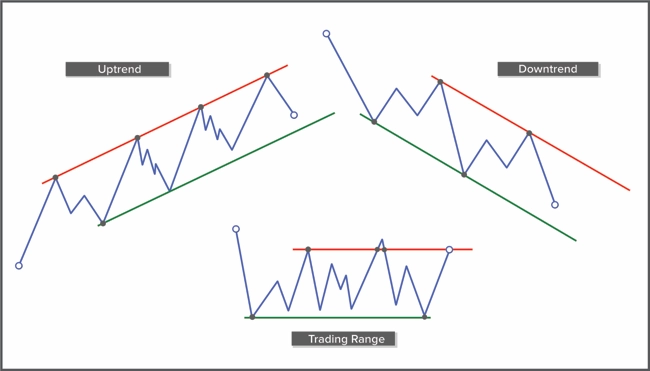
Depending on the direction of movement, we can differentiate three types of trends: bullish, bearish, and sideways.
Bullish Trend
Price makes a series of rising impulses and retracements, where highs and lows are increasingly higher.
Bearish Trend
Highs and lows are increasingly lower, leaving a series of declining impulses and retracements.
Sideways Trend
Highs and lows remain fluctuating within a price range.
Duration Categories
Trends are divided by duration into three different categories: long, medium, and short term. Since there are no strict rules for classifying them according to timeframe, they can be categorized according to how they fit within the higher one. That is, the short-term trend will be observed within the medium-term trend, which in turn will be within the long-term trend.
Important
The three trends may not move in the same direction. This can present potential problems for the trader. To be effective, doubts must be minimized as much as possible, and the way to do this is to identify in advance the type of trading that will be performed.
The Importance of Timing
A very important condition to consider when selecting the type of trading is Timing (entry calibration).
Success in any type of trading primarily requires good Timing; but success in short-term trading requires perfect Timing.
Advice for Beginners
A beginner should start with long-term trading until achieving consistent success. Short-term trading requires precision that develops with experience.
Trading in Both Directions
Because trends can be different depending on the timeframe, it is possible, though difficult, to have buy and sell positions at the same time.
If the medium-term trend is bullish, a buy position can be taken with the expectation of holding it for some weeks or months; and if meanwhile a short-term bearish trend appears, a brief sell position can be taken and maintain the buy trade at the same time.
Although theoretically possible, it is extremely difficult to maintain the discipline necessary to hold both positions at the same time. Only experienced traders should do it. For beginners, it is better to trade in harmony with the trend and not trade on both sides simultaneously until consistently profitable.
Emotions that Move the Market
You must learn and understand the motives, behavior patterns, and emotions that control the market.
"A bull market is driven by greed; while a bear market is driven by fear."
- Fundamental Principle
These are the main emotions that drive markets. Greed leads to paying higher prices until pushing the price to what is known as an overbought condition.
On the other hand, the panic caused by falls leads to wanting to get rid of positions and sell, adding more momentum to the collapse until reaching oversold conditions.
Having these emotions is not something negative, as long as they are directed toward a positive aspect and you keep in mind that what is truly important is capital protection.
Trend Evaluation
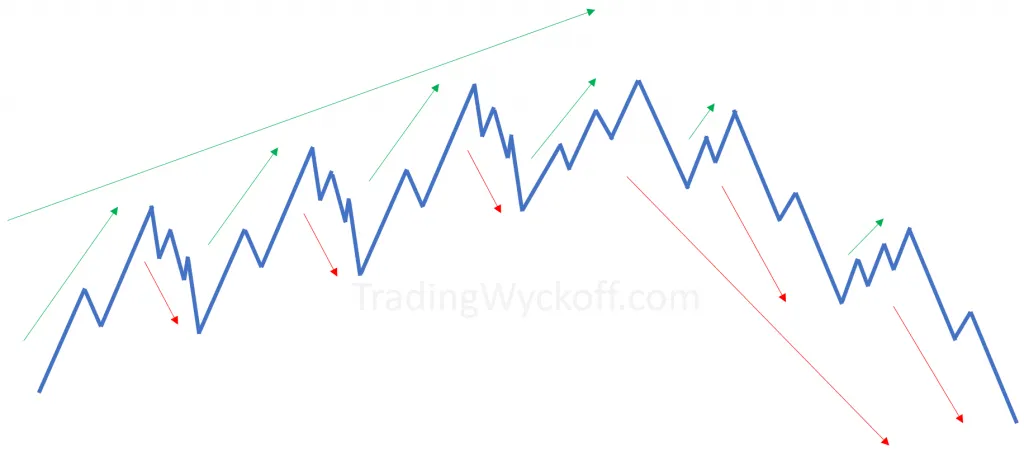
This interaction between supply and demand as a trend develops will leave clues in the price action formation. We have different tools to help us evaluate trends.
Judiciously evaluating the trend is key to determining its health. It allows us to detect if any force shows signs of weakness or if the opposing force is gaining strength. Our job is to go with strength and against weakness.
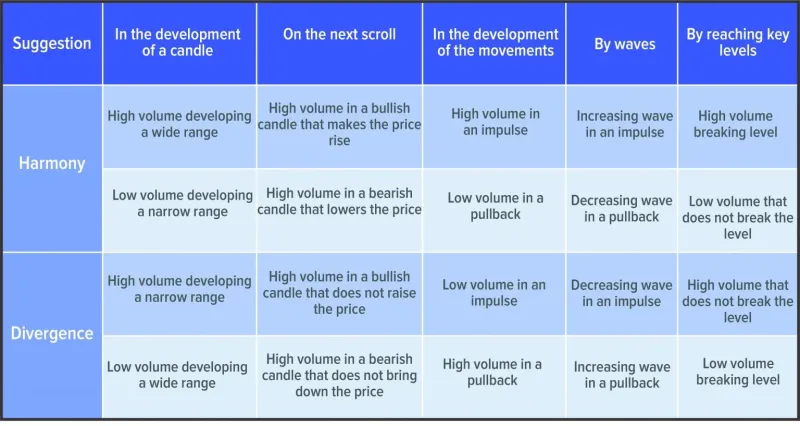
Strength/Weakness Analysis
When price is trending, we expect greater strength from the pressing side. We have to see it as a battle between buyers and sellers where we will try to analyze the strength or weakness of both.
The best way to evaluate current strength/weakness is by comparing it with previously developed movements.
Alert Signal
A weakness in price does not imply a trend change; it is simply a sign of loss of strength and signals that we should be prepared for future movements.
There are several ways to analyze the strength/weakness of the market. The key is comparison. Absolute values are not sought. It is about comparing current movements with previous ones.
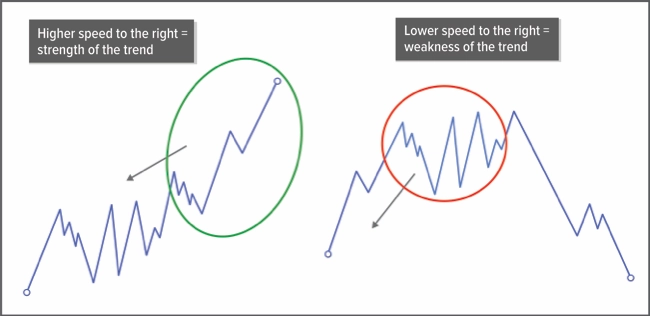
Speed
Speed refers to the angle at which price moves; so if price is moving faster than in the past, there is strength. If on the contrary it is moving slower than in the past, it suggests weakness.
Projection
Through this tool we evaluate the distance that impulses cover and compare them with previous ones to determine if strength has increased or decreased.
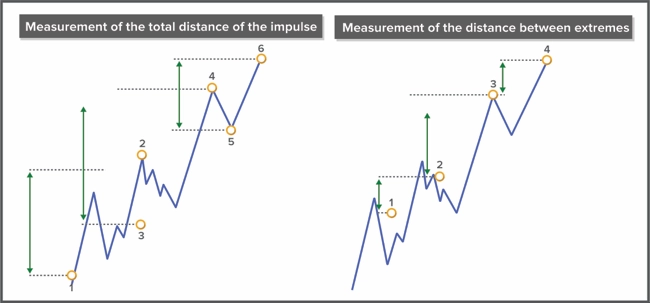
For a trend to remain alive, each impulse must surpass the previous impulse. If an impulse is not able to make new progress in the direction of the trend, it is an alert that the movement may be reaching its end.
Distance of the impulse:
- The distance between 3 and 4 is greater than the distance between 1 and 2 = trend strength.
- The distance between 5 and 6 is less than the distance between 3 and 4 = trend weakness.
Distance between ends:
- The distance between 2 and 3 is greater than the distance between 1 and 2 = trend strength.
- The distance between 3 and 4 is less than the distance between 2 and 3 = trend weakness.
Depth
With depth analysis we evaluate the distance that trend retracements cover to determine if weakness has increased or decreased.
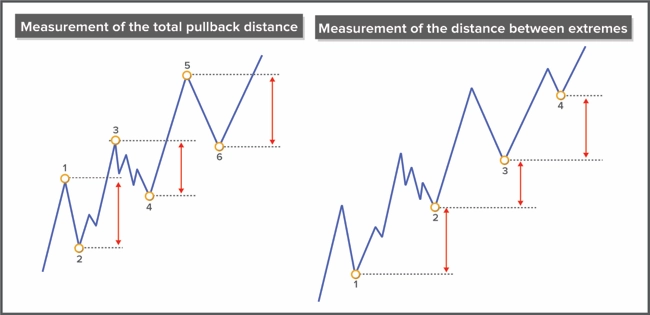
Pullback distance:
- The distance between 3 and 4 is less than the distance between 1 and 2 = trend strength.
- The distance between 5 and 6 is greater than the distance between 3 and 4 = trend weakness.
Distance between ends:
- The distance between 2 and 3 is less than the distance between 1 and 2 = trend weakness.
- The distance between 3 and 4 is greater than the distance between 2 and 3 = trend strength.
As with projection analysis, we can evaluate depth through two measurements: the total distance of the retracement from its origin to its extreme; and the distance the price travels from the previous extreme to the new extreme.
Lines
Lines delimit ranges and define the angle of advance of a trend.
They are of great visual help for analysis, being very useful for evaluating the health of the movement; both for identifying when price reaches an exhaustion condition, and for valuing a possible market turn.
In general, lines help us foresee support and resistance levels where we can expect price. At the same time, an approach or touch of those lines suggests the search for additional signals to look for a turn, offering various trading opportunities.
The more touches a line has, the more validity the level will have for analysis.
Caution
You should be careful to avoid drawing lines indiscriminately, especially over every minor movement. Correct line management requires good judgment; otherwise, it will produce confusion in your reasoning.
When price penetrates some line, we must remain more alert and be prepared to act.
Depending on the position where the breakout occurs, as well as the action itself, it may suggest different scenarios. A deep understanding of price action and volume is needed to determine the most probable scenarios.
Horizontal Lines
A horizontal line identifies an old zone of imbalance between supply and demand.
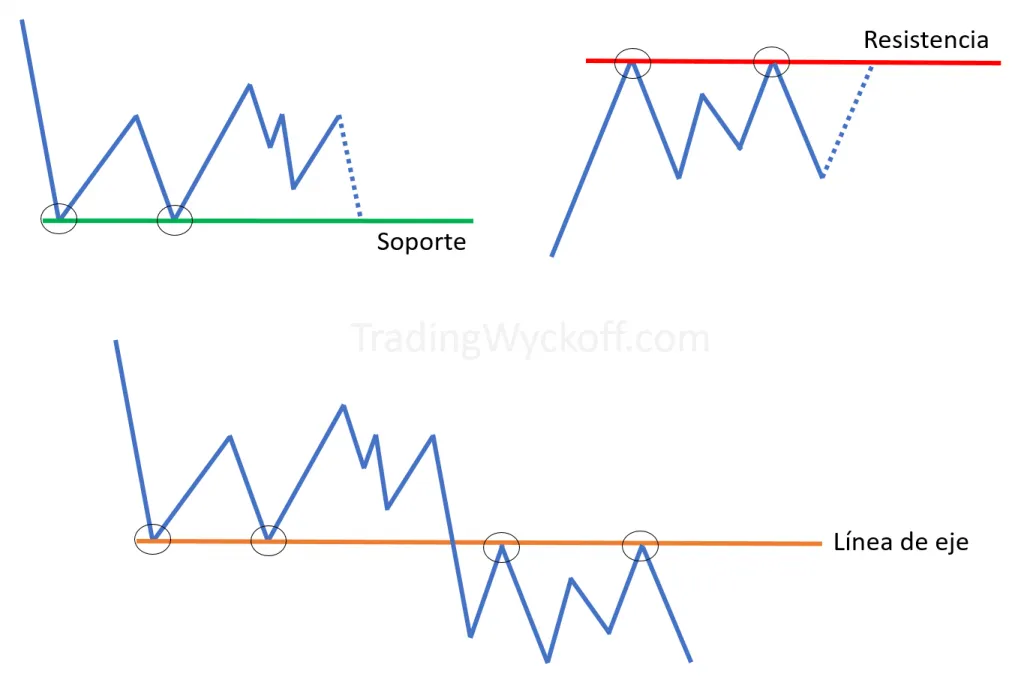
Support
When connecting at least two price lows, it identifies a support. It is a zone where buyers appeared in the past to overcome sellers, managing to stop the price fall. It is expected that buyers will reappear on that zone when it is visited again.
Resistance
A horizontal line connecting at least two highs identifies a resistance and it is an area where supply exceeded demand stopping a price rise; that is why sellers are expected to reappear on a future visit.
Axis Line
When a line serves both as support and as resistance, it is known as an axis line. Prices tend to rotate around these axis lines.
Role Change
These price levels constantly change roles: a broken resistance becomes a support, and a broken support becomes a resistance.
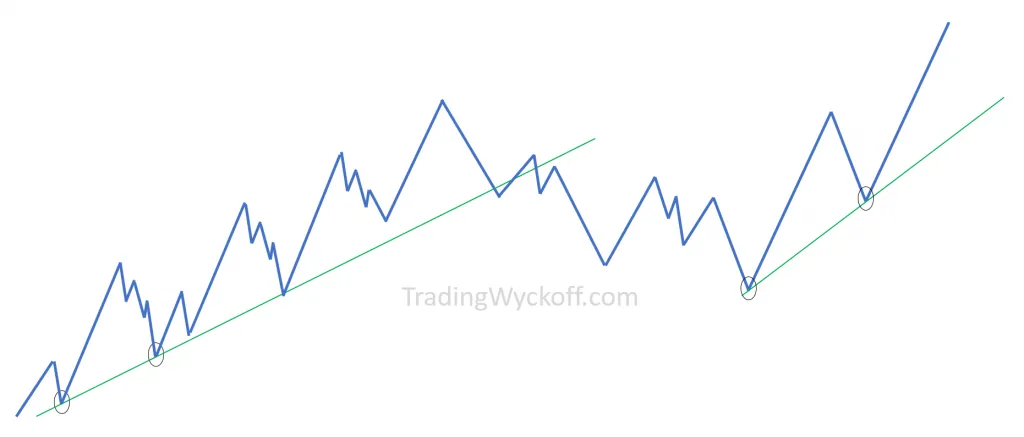
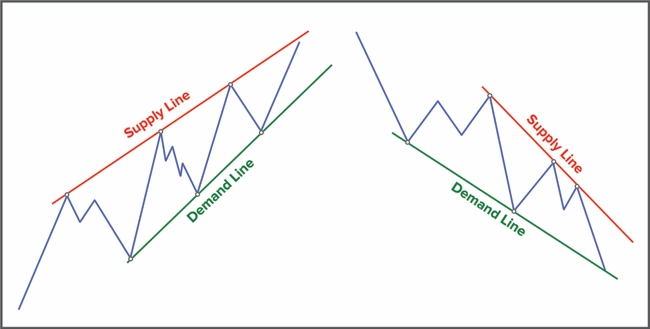
Trend Lines
After identifying the nature of the trend, the next step is to construct a guideline to take advantage of the movement. It is simply the connection between two or more price points.
- Downtrend: The trend line is drawn by connecting two declining highs. This line is called the supply line since it is presumed that sellers will appear on it.
- Uptrend: The trend line is drawn by connecting two rising lows. This line is called the demand line since it marks the point where buyers are supposed to appear.
We can continuously readjust trend lines with the aim of adjusting to the one that best fits the price action and therefore has generated the most touches.
The more times a line has been respected, the stronger we can interpret it when it is touched again in the future.
Keep in mind that a line with too much slope will be broken too soon, so it would not be correctly drawn.
While price remains within established levels, the movement is said to be healthy and it is appropriate to consider holding or adding positions.
When price approaches a trend line there is a threat of breakout and this may mean that the trend's strength is being exhausted, suggesting a change in trend speed or a definite danger of trend reversal.
The Breakout Is Not Conclusive
The breakout of a trend line by itself is not a conclusive symptom of anything, as it may be a true or false breakout. What is significant is how the line is broken, the conditions under which it happens, and the behavior that precedes it.
After a movement of certain distance, price may find resistance to continue and this causes the trend to modify its speed and rest.
During the rest (sideways movement or range) the force that originally drove the trend may renew or even strengthen, which will result in a continuation of the trend with greater momentum than before.
Under these conditions, it is necessary to reposition the trend lines to conform to the new established angle. Therefore, one should not accept that just because the trend line is broken it is a reversal of it.
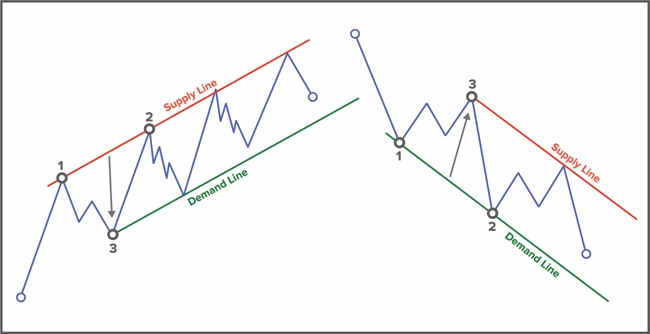
Channels
The ideal channel will have several touch points and should capture most of the price within its limits.

Bullish Channel
When the bullish trend line or demand line is dragged to the opposite extreme anchoring itself in parallel over the high that is located between the two lows used for its creation, the overbought line is created; and together they define a bullish trend channel.
This channel identifies a rising price.
Overbought Conditions
The trader should be aware of overbought conditions. These conditions are created when price exceeds the upper part of the bullish channel. Due to too rapid acceleration, price reaches a point where it is highly sensitive to long covering and in general to the withdrawal of the most experienced buyers; suggesting a weakening of the bullish trend.
The human being seems to have an inclination toward extremes. In financial markets this tendency is revealed in the form of greed. Prices are pushed higher and higher until the public gorges on stocks that are generally overvalued. When this happens, it is said that an overbought condition exists.
Bearish Channel
When the bearish trend line or supply line is dragged to the opposite extreme and anchored in parallel over the low that is located between the two highs used for its creation, the oversold line is created; and together they define a bearish trend channel.
This channel identifies a falling price.
Oversold Conditions
The trader should be aware of oversold conditions. These conditions are created when price exceeds the lower part of the bearish channel. Due to too rapid bearish movement, price reaches a point where it is highly sensitive to short covering (profit taking) and a general withdrawal of experienced traders who were short.
In a bear market there is another extreme that takes control: fear. As the price falls, traders become alarmed. The more it falls, the more frightened they are. Fear reaches a level that weak hands cannot withstand and they sell their stocks. This panic selling generates an oversold condition.
These periods of excess buying or selling that lead to movement stops can be seen in any timeframe.
Inverted and Convergent Lines
Inverted Lines
In high-speed conditions where a clear trend has not yet been established, inverted lines are a good way to try to structure at least initially the price movement.
It is about creating first the supply line in a bullish trend to generate from it the demand line; and creating first the demand line in a bearish trend to generate from it the supply line.
Practical Application
At the beginning of a bullish advance, if the price has made two important upward pushes without leaving any significant bearish retracement, you can estimate at what point to expect the price retracement by first creating the supply line to drag it and create the bullish trend line; and similarly draw first the demand line to create from it the bearish trend line.
Convergent Lines
There will be occasions when you will observe that the overbought and oversold lines created from their trend lines do not work effectively.
Price may never reach those lines as it is probably following a different movement dynamic.
The way to solve this deficiency is to create these lines independently, without taking into account the trend line.
In this way, an overbought line would be created by connecting two highs and the oversold line by connecting two lows. The objective is to try to find the structural logic of the movements to take advantage of them.
Keep in mind that for the case of bullish movement, the fact of not being able to even reach the original overbought line denotes a symptom of weakness and alerts us to a possible turn to the downside.
Similarly, the fact of not being able to reach the original oversold line for the case of bearish movement denotes a symptom of underlying strength and alerts us to a possible turn to the upside.
Visually they are observed as exhaustion patterns.
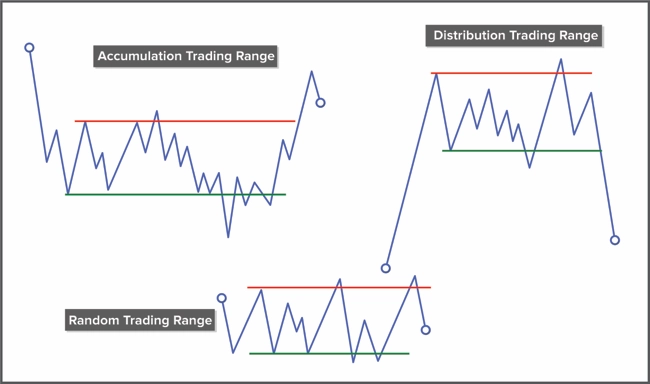
Ranges
The market spends most of its time in this type of condition, therefore they are extremely important.
Range Definition
Ranges are places where the previous movement has been stopped and there is a relative equilibrium between supply and demand. It is within the range where accumulation or distribution campaigns develop in preparation for a bullish or bearish trend.
It is this force of accumulation or distribution that builds the cause that develops the subsequent movement.
Ranges present within them optimal trading opportunities with very favorable potential risk/reward; however, the great trades are those where you correctly manage to position yourself within the range to take advantage of the trend movement.
In trend trading, as price is already moving, part of its travel will have been lost. By taking advantage of opportunities within the range, there are possibilities to catch a larger movement.
To be correctly positioned at the beginning of the trend, you must be able to analyze price action and volume during the development of the range.
Fortunately, the Wyckoff methodology offers unique guidelines with which the trader can successfully carry out this task. Event identification and phase analysis become indispensable tools for correct range reading.
If you don't observe a clearly defined trend, the price is most likely in a range context.
Three Fundamental Interests
This neutral or sideways trend can have behind it three fundamental interests:
Accumulation Is Taking Place
In preparation for a bullish movement. Professionals are buying.
Distribution Is Taking Place
In preparation for a bearish movement. Professionals are selling.
Random Fluctuations
With no defined interest. They should be ignored as there is probably no professional interest behind that market.
Important
It is important to understand that not all ranges have professional interest; and therefore, if these interests are not involved in a security, the price simply fluctuates because it is in equilibrium and movements in one direction are neutralized by movements in the opposite direction.
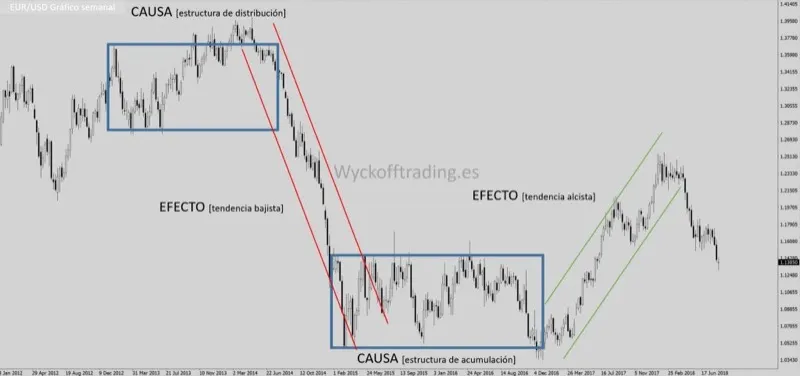
The Law of Cause and Effect
Based on the law of cause and effect, it is necessary for price to spend time within the range in preparation for the subsequent movement. And that movement will be directly proportional to the time spent in the range.
- Short-duration ranges will generate shorter movements
- Longer-duration ranges will generate movements that cover greater distance
- To define a range, two points are required to construct the channel
- While price remains within the range, no major movement will occur
The Key Is at the Extremes
The key is at the extremes. When these are broken, they can offer excellent trading opportunities.
Decisive Movement
The decisive breakout movement from the range and start of the trend phase cannot occur until a clear imbalance between supply and demand has been generated. At that point, the market must be in control of the professionals and they must have confirmed that the direction they will drive the price is the path of least resistance.
This means that if they have accumulated with the intention of launching prices upward, they will first verify that they will not encounter resistance (selling) that stops that rise. When they verify that the path is clear, they will initiate the movement.
Similarly, if they have been distributing (selling) with the intention of lowering prices, they need to make sure that the floating demand (buying interest) is relatively low.
"The effect performed by the cause will always be in direct proportion to that cause. A large cause will produce a greater effect, and a small cause will result in a smaller effect."
- Wyckoff Principle
Wyckoff in Depth
This article is an excerpt from the book. If you want to completely master how markets move according to the Wyckoff methodology, the book provides you with all the necessary knowledge with practical examples and real case studies.
View book